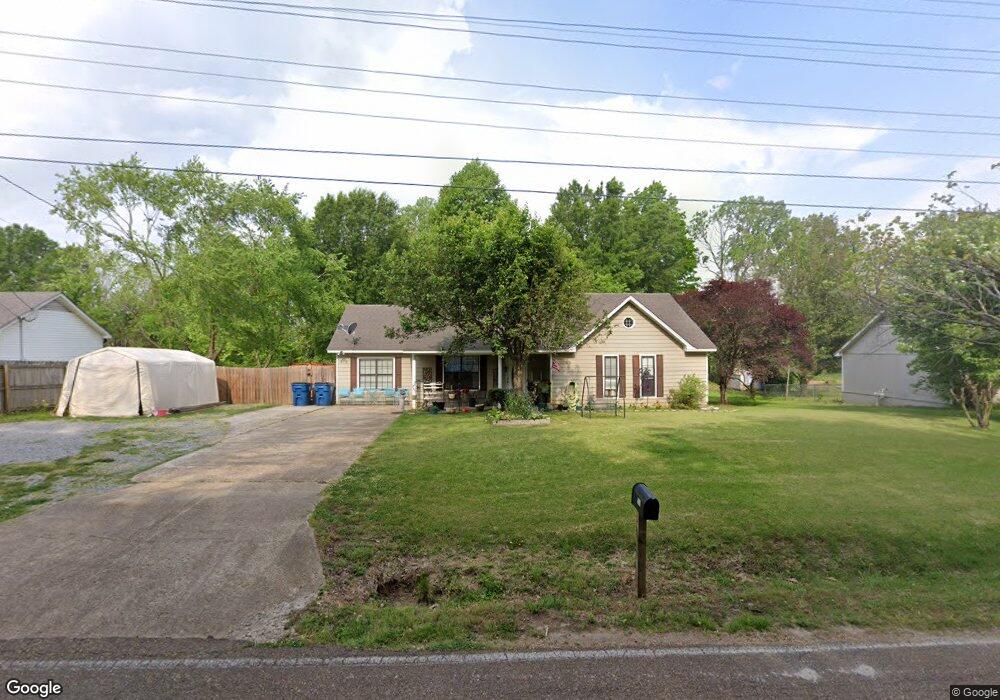
231 Turner Dairy Rd Covington, TN 38019
Estimated Value: $181,000 - $223,000
--
Bed
--
Bath
1,553
Sq Ft
$129/Sq Ft
Est. Value
About This Home
This home is located at 231 Turner Dairy Rd, Covington, TN 38019 and is currently estimated at $200,342, approximately $129 per square foot. 231 Turner Dairy Rd is a home with nearby schools including Crestview Elementary School, Crestview Middle School, and Covington High School.
Ownership History
Date
Name
Owned For
Owner Type
Purchase Details
Closed on
Feb 5, 2019
Sold by
Loyed Robert E
Bought by
Mallard Marilyn R
Current Estimated Value
Home Financials for this Owner
Home Financials are based on the most recent Mortgage that was taken out on this home.
Original Mortgage
$95,959
Outstanding Balance
$84,193
Interest Rate
4.4%
Mortgage Type
New Conventional
Estimated Equity
$116,149
Purchase Details
Closed on
Jan 25, 2011
Sold by
Wade Joseph A
Bought by
Loyed Robert E
Purchase Details
Closed on
Jun 30, 1995
Bought by
Wade Joseph A and Wade Amanda T
Purchase Details
Closed on
Feb 2, 1989
Bought by
Gibson Kenneth Hughes and Poole Karen
Purchase Details
Closed on
Mar 24, 1988
Bought by
Richardson Rory Lee and Janet Lee
Purchase Details
Closed on
Mar 15, 1983
Bought by
Brotherton Frank A and Brotherton Martha M
Purchase Details
Closed on
Apr 26, 1982
Create a Home Valuation Report for This Property
The Home Valuation Report is an in-depth analysis detailing your home's value as well as a comparison with similar homes in the area
Home Values in the Area
Average Home Value in this Area
Purchase History
| Date | Buyer | Sale Price | Title Company |
|---|---|---|---|
| Mallard Marilyn R | $95,000 | -- | |
| Loyed Robert E | $15,000 | -- | |
| Wade Joseph A | $62,500 | -- | |
| Gibson Kenneth Hughes | $53,000 | -- | |
| Richardson Rory Lee | $6,400 | -- | |
| Brotherton Frank A | -- | -- | |
| -- | -- | -- |
Source: Public Records
Mortgage History
| Date | Status | Borrower | Loan Amount |
|---|---|---|---|
| Open | Mallard Marilyn R | $95,959 |
Source: Public Records
Tax History Compared to Growth
Tax History
| Year | Tax Paid | Tax Assessment Tax Assessment Total Assessment is a certain percentage of the fair market value that is determined by local assessors to be the total taxable value of land and additions on the property. | Land | Improvement |
|---|---|---|---|---|
| 2024 | $898 | $35,425 | $7,300 | $28,125 |
| 2023 | $898 | $35,425 | $7,300 | $28,125 |
| 2022 | $817 | $24,925 | $5,375 | $19,550 |
| 2021 | $818 | $24,925 | $5,375 | $19,550 |
| 2020 | $817 | $24,925 | $5,375 | $19,550 |
| 2019 | $849 | $22,625 | $5,000 | $17,625 |
| 2018 | $849 | $22,625 | $5,000 | $17,625 |
| 2017 | $849 | $22,625 | $5,000 | $17,625 |
| 2016 | $849 | $22,625 | $5,000 | $17,625 |
| 2015 | $848 | $22,625 | $5,000 | $17,625 |
| 2014 | $848 | $22,636 | $0 | $0 |
Source: Public Records
Map
Nearby Homes
- 902 Hatchie Ave
- 900 Peete St
- 000 Davis St
- 117 E Ripley Ave
- 0 N Munford St Unit 10156264
- 0 N Munford St Unit 10156263
- 320 N Maple St
- 133 W Washington Ave
- 325 Baxter Ave Unit 327
- 111 W Washington Ave
- 509 S College St
- 513 Garland Ave
- 212 S Tipton St
- 296 E Washington Ave Unit 3
- 600 W Sherrod Ave
- 406 E Pleasant Ave
- 714 W Sherrod Ave
- 316 Sanford Ave
- 210 Kinney Ave
- 711 S Main St
- 251 Turner Ln
- 211 Turner Dairy Rd
- 271 Turner Ln
- 271 Turner Field Rd
- 287 Turner Dairy Rd
- 196 Turner Field Rd
- 169 Turner Dairy Rd
- 218 Groom Ave
- 182 182 Turner Ln
- 216 Groom Ave
- 220 Groom Ave
- 305 Turner Dairy Rd
- 305 Turner Field Rd
- 214 Groom Ave
- 212 Groom Ave
- 222 Groom Ave
- 146 Turner Field Rd
- 325 Turner Dairy Rd
- 149 Turner Field Rd
- 210 Groom Ave