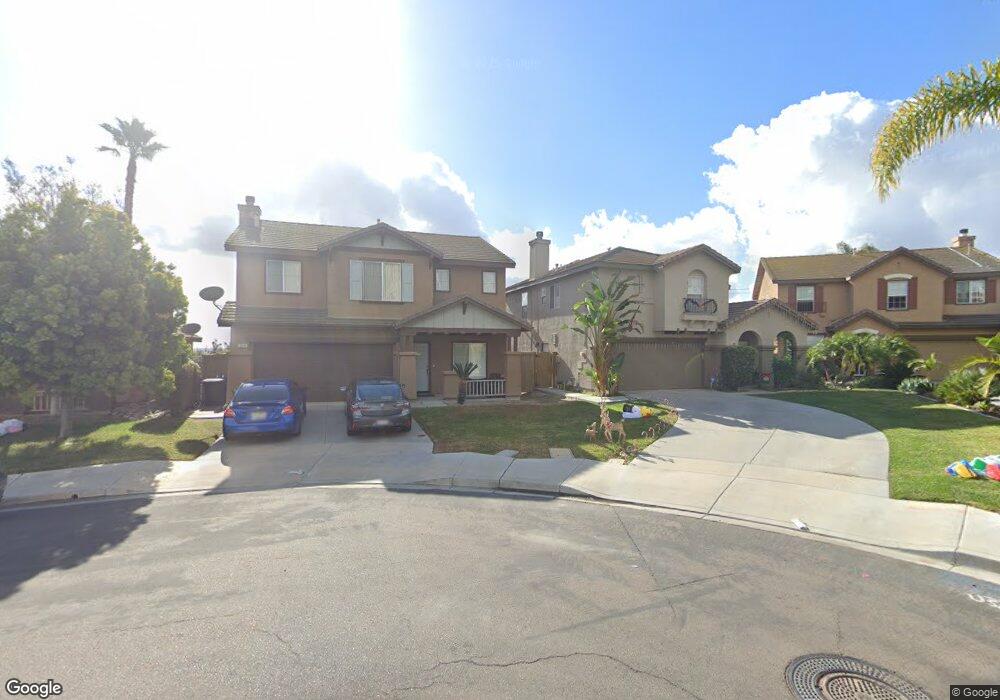
2310 Peacock Valley Rd Chula Vista, CA 91915
Eastlake NeighborhoodEstimated Value: $892,559 - $930,000
4
Beds
3
Baths
1,911
Sq Ft
$476/Sq Ft
Est. Value
About This Home
This home is located at 2310 Peacock Valley Rd, Chula Vista, CA 91915 and is currently estimated at $909,890, approximately $476 per square foot. 2310 Peacock Valley Rd is a home located in San Diego County with nearby schools including Olympic View Elementary School, Eastlake Middle School, and Eastlake High School.
Ownership History
Date
Name
Owned For
Owner Type
Purchase Details
Closed on
Oct 12, 2010
Sold by
Abante Vivencio B and Abante Felisa C
Bought by
Gonzales Carlos K and Gonzales Dolores A
Current Estimated Value
Home Financials for this Owner
Home Financials are based on the most recent Mortgage that was taken out on this home.
Original Mortgage
$357,525
Interest Rate
4.18%
Mortgage Type
VA
Purchase Details
Closed on
Dec 13, 2005
Sold by
Abante Vivencio B and Abante Felisa C
Bought by
Abante Vivencio B and Abante Felisa C
Home Financials for this Owner
Home Financials are based on the most recent Mortgage that was taken out on this home.
Original Mortgage
$472,500
Interest Rate
6.31%
Mortgage Type
Negative Amortization
Purchase Details
Closed on
Aug 30, 2004
Sold by
Abante Vivencio B and Abante Felisa C
Bought by
Abante Vivencio B and Abante Felisa C
Purchase Details
Closed on
Mar 23, 1999
Sold by
Kaufman & Broad Coastal Inc
Bought by
Abante Vivencio B and Abante Felisa C
Home Financials for this Owner
Home Financials are based on the most recent Mortgage that was taken out on this home.
Original Mortgage
$211,800
Interest Rate
6.86%
Create a Home Valuation Report for This Property
The Home Valuation Report is an in-depth analysis detailing your home's value as well as a comparison with similar homes in the area
Home Values in the Area
Average Home Value in this Area
Purchase History
| Date | Buyer | Sale Price | Title Company |
|---|---|---|---|
| Gonzales Carlos K | $350,000 | Lawyers Title | |
| Abante Vivencio B | -- | Ticor Title Co Of California | |
| Abante Vivencio B | -- | -- | |
| Abante Vivencio B | $223,000 | First American Title |
Source: Public Records
Mortgage History
| Date | Status | Borrower | Loan Amount |
|---|---|---|---|
| Previous Owner | Gonzales Carlos K | $357,525 | |
| Previous Owner | Abante Vivencio B | $472,500 | |
| Previous Owner | Abante Vivencio B | $211,800 |
Source: Public Records
Tax History Compared to Growth
Tax History
| Year | Tax Paid | Tax Assessment Tax Assessment Total Assessment is a certain percentage of the fair market value that is determined by local assessors to be the total taxable value of land and additions on the property. | Land | Improvement |
|---|---|---|---|---|
| 2025 | $5,058 | $448,396 | $181,045 | $267,351 |
| 2024 | $5,058 | $439,605 | $177,496 | $262,109 |
| 2023 | $6,276 | $430,986 | $174,016 | $256,970 |
| 2022 | $6,070 | $422,536 | $170,604 | $251,932 |
| 2021 | $5,921 | $414,252 | $167,259 | $246,993 |
| 2020 | $5,771 | $410,005 | $165,544 | $244,461 |
| 2019 | $5,621 | $401,967 | $162,299 | $239,668 |
| 2018 | $5,519 | $394,086 | $159,117 | $234,969 |
| 2017 | $5,419 | $386,360 | $155,998 | $230,362 |
| 2016 | $5,516 | $378,786 | $152,940 | $225,846 |
| 2015 | $5,454 | $373,097 | $150,643 | $222,454 |
| 2014 | $5,791 | $365,790 | $147,693 | $218,097 |
Source: Public Records
Map
Nearby Homes
- 1551 Caminito Cremona
- 2235 Old Barn Ln
- 2408 Green River Dr
- 1446 Caminito Sardinia
- 1445 Caminito Sicilia
- 2088 Bravo Loop
- 2065 Bravo Loop Unit 6
- 1575 Wishing Star Dr
- 1624 Filaree Dr Unit 155
- 1623 Gila Ct Unit 175
- 1623 Gila Ct Unit 177
- 0 Towncenter Lot#4
- 2471 Myrtle Beach Way
- 2181 Caminito Norina Unit 134
- 2329 Dragonfly St
- 2180 Birch Rd Unit 118
- 1338 Caminito Fabrizio Unit 72
- 1733 Cripple Creek Dr Unit 4
- 1715 Rolling Water Dr Unit 4
- 1924 Crossroads St
- 2306 Peacock Valley Rd
- 2314 Peacock Valley Rd
- 2318 Peacock Valley Rd
- 2302 Peacock Valley Rd
- 2322 Peacock Valley Rd
- 2315 Peacock Valley Rd
- 2319 Peacock Valley Rd
- 1480 Knollwood Place
- 2326 Peacock Valley Rd
- 2330 Peacock Valley Rd Unit 10
- 2251 Poppy Hills Dr
- 1476 Knollwood Place
- 2331 Peacock Valley Rd
- 2255 Poppy Hills Dr
- 2334 Peacock Valley Rd
- 1472 Knollwood Place
- 2335 Peacock Valley Rd
- 2259 Poppy Hills Dr
- 1475 Knollwood Place
- 2338 Peacock Valley Rd