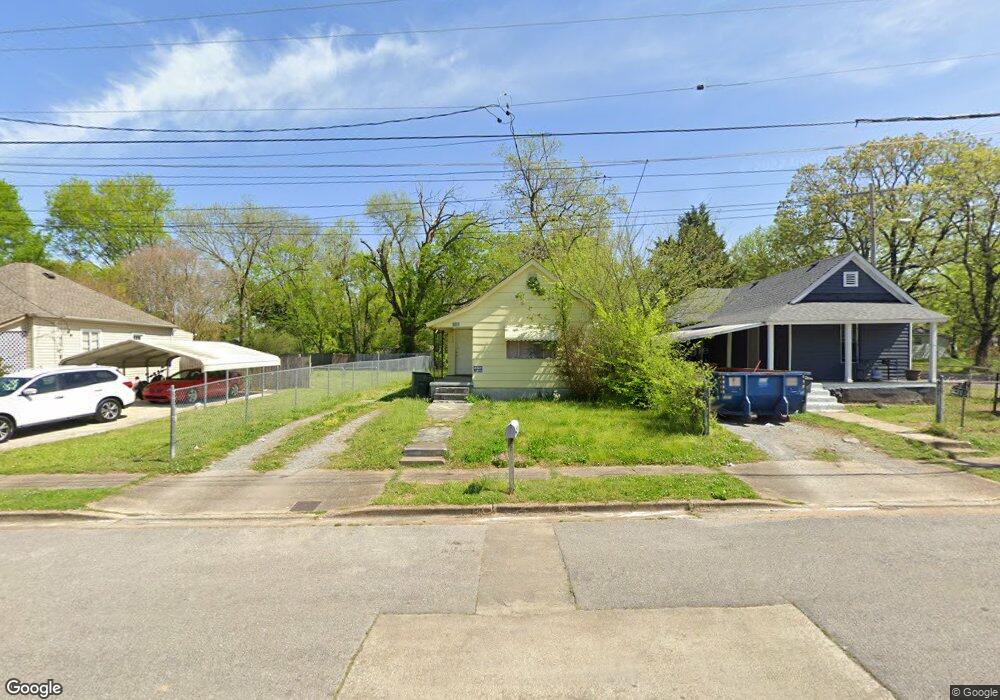
2313 E 35th St Chattanooga, TN 37407
Cedar Hill NeighborhoodEstimated Value: $74,000 - $152,178
2
Beds
1
Bath
729
Sq Ft
$171/Sq Ft
Est. Value
About This Home
This home is located at 2313 E 35th St, Chattanooga, TN 37407 and is currently estimated at $124,295, approximately $170 per square foot. 2313 E 35th St is a home located in Hamilton County with nearby schools including Clifton Hills Elementary, East Lake Academy Of Fine Arts, and The Howard School.
Ownership History
Date
Name
Owned For
Owner Type
Purchase Details
Closed on
May 19, 2023
Sold by
Suttles James
Bought by
Thornhill Management Group Llc
Current Estimated Value
Home Financials for this Owner
Home Financials are based on the most recent Mortgage that was taken out on this home.
Original Mortgage
$144,000
Outstanding Balance
$139,531
Interest Rate
6.39%
Mortgage Type
Construction
Estimated Equity
-$15,236
Purchase Details
Closed on
May 17, 2023
Sold by
Birdland Properties Llc
Bought by
Suttles James
Home Financials for this Owner
Home Financials are based on the most recent Mortgage that was taken out on this home.
Original Mortgage
$144,000
Outstanding Balance
$139,531
Interest Rate
6.39%
Mortgage Type
Construction
Estimated Equity
-$15,236
Purchase Details
Closed on
Nov 17, 2017
Sold by
Martin Nancy Sue Mullins
Bought by
Birdland Properties Llc
Purchase Details
Closed on
Aug 28, 2016
Sold by
Mullins Joseph G and Mullins Kenneth L
Bought by
Mullins Martin Nancy Sue
Create a Home Valuation Report for This Property
The Home Valuation Report is an in-depth analysis detailing your home's value as well as a comparison with similar homes in the area
Home Values in the Area
Average Home Value in this Area
Purchase History
| Date | Buyer | Sale Price | Title Company |
|---|---|---|---|
| Thornhill Management Group Llc | $160,000 | Ensign Title | |
| Suttles James | $70,000 | Ensign Title & Escrow, Inc | |
| Birdland Properties Llc | $31,000 | Title Svcs Of Tennessee Inc | |
| Smith Linda | -- | Title Sevs Of Tennessee Inc | |
| Mullins Martin Nancy Sue | -- | None Available |
Source: Public Records
Mortgage History
| Date | Status | Borrower | Loan Amount |
|---|---|---|---|
| Open | Thornhill Management Group Llc | $144,000 |
Source: Public Records
Tax History
| Year | Tax Paid | Tax Assessment Tax Assessment Total Assessment is a certain percentage of the fair market value that is determined by local assessors to be the total taxable value of land and additions on the property. | Land | Improvement |
|---|---|---|---|---|
| 2025 | $471 | $31,100 | $0 | $0 |
| 2024 | $345 | $15,400 | $0 | $0 |
| 2023 | $345 | $15,400 | $0 | $0 |
| 2022 | $154 | $6,900 | $0 | $0 |
| 2021 | $154 | $6,900 | $0 | $0 |
| 2020 | $179 | $6,475 | $0 | $0 |
| 2019 | $179 | $6,475 | $0 | $0 |
| 2018 | $274 | $6,475 | $0 | $0 |
| 2017 | $131 | $4,750 | $0 | $0 |
| 2016 | $125 | $0 | $0 | $0 |
| 2015 | $345 | $4,525 | $0 | $0 |
| 2014 | $345 | $0 | $0 | $0 |
Source: Public Records
Map
Nearby Homes
- 3612 5th Ave
- 3513 3rd Ave
- 3117 10th Ave
- 3113 10th Ave
- 2585 E 40th St
- 3212 14th Ave
- 3017 13th Ave
- 2810 5th Ave
- 3045 Westside Dr
- 1241 E 35th St
- 551 W Shadowlawn Dr
- 3903 17th Ave
- 2008 Foust St
- 2603 E 44th St
- 4319 10th Ave
- 2912 Calhoun Ave
- 2917 Crescent Cir
- 2909 E Crescent Cir
- 4317 13th Ave
- 2809 E 45th St
Your Personal Tour Guide
Ask me questions while you tour the home.