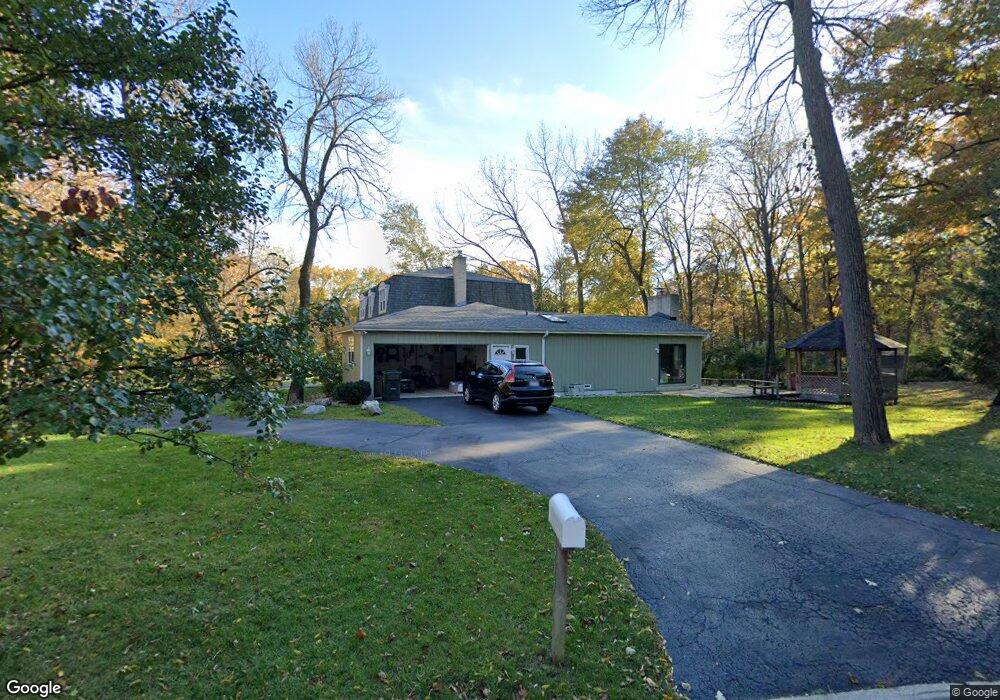
2317 Trillium Ln Naperville, IL 60565
Whalon Lake NeighborhoodEstimated Value: $634,047 - $731,000
--
Bed
1
Bath
2,569
Sq Ft
$268/Sq Ft
Est. Value
About This Home
This home is located at 2317 Trillium Ln, Naperville, IL 60565 and is currently estimated at $688,262, approximately $267 per square foot. 2317 Trillium Ln is a home located in Will County with nearby schools including River Woods Elementary School, Madison Jr High School, and Naperville Central High School.
Ownership History
Date
Name
Owned For
Owner Type
Purchase Details
Closed on
Aug 20, 2004
Sold by
Desalvo Steven J
Bought by
Desalvo Steven J and Steven J Desalvo Trust
Current Estimated Value
Purchase Details
Closed on
Aug 3, 2001
Sold by
Marquardt Sharon H
Bought by
Desalvo Steven J
Home Financials for this Owner
Home Financials are based on the most recent Mortgage that was taken out on this home.
Original Mortgage
$150,000
Interest Rate
7.28%
Mortgage Type
Balloon
Purchase Details
Closed on
Nov 20, 1998
Sold by
Houston Ronald L and Houston Veronica M
Bought by
Marquardt Sharon H
Purchase Details
Closed on
Oct 28, 1996
Sold by
Romine Jack F and Romine Joan F
Bought by
Houston Ronald L and Houston Veronica M
Home Financials for this Owner
Home Financials are based on the most recent Mortgage that was taken out on this home.
Original Mortgage
$214,650
Interest Rate
7.5%
Create a Home Valuation Report for This Property
The Home Valuation Report is an in-depth analysis detailing your home's value as well as a comparison with similar homes in the area
Home Values in the Area
Average Home Value in this Area
Purchase History
| Date | Buyer | Sale Price | Title Company |
|---|---|---|---|
| Desalvo Steven J | -- | -- | |
| Desalvo Steven J | $315,500 | -- | |
| Marquardt Sharon H | $260,000 | First American Title Ins Co | |
| Houston Ronald L | $238,500 | Collar Counties Title Plant |
Source: Public Records
Mortgage History
| Date | Status | Borrower | Loan Amount |
|---|---|---|---|
| Closed | Desalvo Steven J | $150,000 | |
| Previous Owner | Houston Ronald L | $214,650 |
Source: Public Records
Tax History Compared to Growth
Tax History
| Year | Tax Paid | Tax Assessment Tax Assessment Total Assessment is a certain percentage of the fair market value that is determined by local assessors to be the total taxable value of land and additions on the property. | Land | Improvement |
|---|---|---|---|---|
| 2024 | $11,143 | $188,556 | $52,510 | $136,046 |
| 2023 | $11,143 | $169,657 | $47,247 | $122,410 |
| 2022 | $10,687 | $169,950 | $47,329 | $122,621 |
| 2021 | $10,064 | $158,906 | $44,253 | $114,653 |
| 2020 | $9,695 | $153,681 | $42,798 | $110,883 |
| 2019 | $9,351 | $146,363 | $40,760 | $105,603 |
| 2018 | $8,910 | $140,087 | $39,012 | $101,075 |
| 2017 | $8,583 | $132,784 | $36,978 | $95,806 |
| 2016 | $8,290 | $126,400 | $35,200 | $91,200 |
| 2015 | $8,480 | $121,300 | $33,800 | $87,500 |
| 2014 | $8,480 | $121,300 | $33,800 | $87,500 |
| 2013 | $8,480 | $121,300 | $33,800 | $87,500 |
Source: Public Records
Map
Nearby Homes
- 2248 Aster Ct
- 25 W 500 Royce Rd
- 1120 Colgate Ct
- 707 Crestview Dr
- 2230 Keim Rd Unit 3B
- 541 Boardman Cir
- 743 Arlington Ave
- 816 Spindletree Ave
- 805 Potomac Ave
- 710 Alexandria Dr
- 705 Potomac Ave
- 627 Nanak Ct
- VACANT W Boughton Rd
- 1704 Kenyon Dr
- 556 Pontiac Ln Unit 5
- 267 Clarendon Ln Unit 1
- 342 Dilorenzo Dr
- 329 Redwing Dr
- 2280 Barth Dr
- 336 Brooklea Ct
- 2325 Trillium Ln
- 1624 Mayapple Ct
- 1600 Mayapple Ct
- 2308 Trillium Ln
- 2333 Trillium Ln
- 2316 Trillium Ln
- 1616 Mayapple Ct
- 1700 Wild Rose Ct
- 1608 Mayapple Ct
- 2301 Trillium Ln
- 2341 Trillium Ln
- 1524 Blackberry Ct
- 1716 Chaucer Ct
- 2332 Trillium Ln
- 2260 Aster Ct
- 1708 Wild Rose Ct
- 2349 Trillium Ln
- 1700 Chaucer Ct
- 2257 Trillium Ln
- 2259 Aster Ct