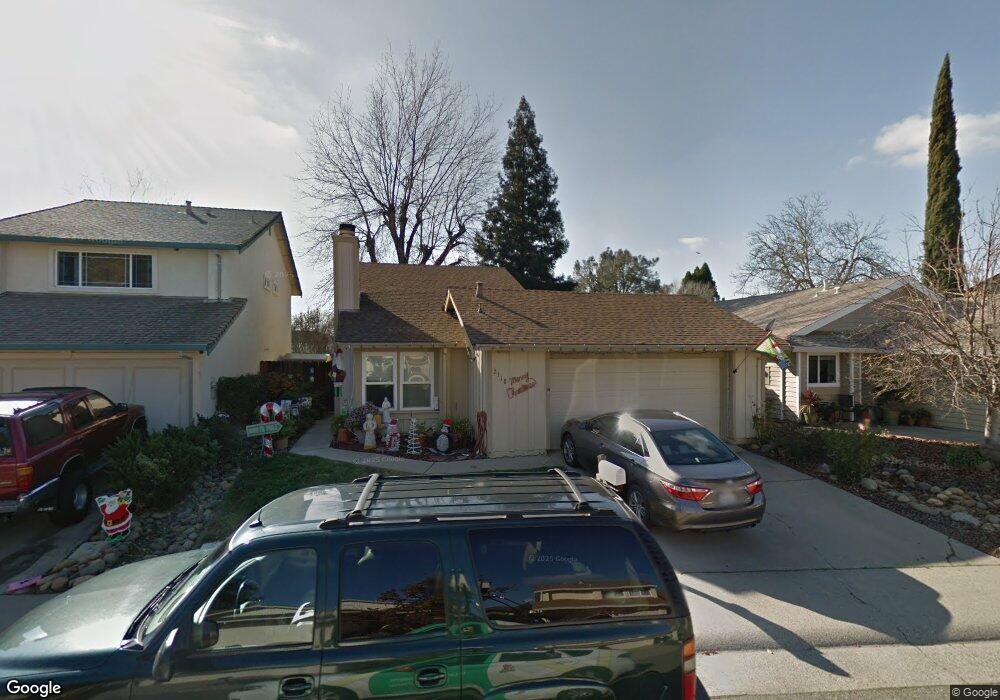
2318 Walnut Grove Way Rancho Cordova, CA 95670
Mills Ranch NeighborhoodEstimated Value: $383,000 - $450,000
3
Beds
2
Baths
1,350
Sq Ft
$316/Sq Ft
Est. Value
About This Home
This home is located at 2318 Walnut Grove Way, Rancho Cordova, CA 95670 and is currently estimated at $426,983, approximately $316 per square foot. 2318 Walnut Grove Way is a home located in Sacramento County with nearby schools including Peter J. Shields Elementary School, Riverview STEM Elementary School, and Mills Middle School.
Ownership History
Date
Name
Owned For
Owner Type
Purchase Details
Closed on
Feb 21, 2017
Sold by
Basso Gino Mario and Basso Sonya Christine
Bought by
Basso Gino and Basso Sonya
Current Estimated Value
Purchase Details
Closed on
Aug 21, 2002
Sold by
Basso Gino Mario and Basso Sonya Christine
Bought by
Basso Gino Mario and Basso Sonya Christine
Home Financials for this Owner
Home Financials are based on the most recent Mortgage that was taken out on this home.
Original Mortgage
$125,000
Interest Rate
6.43%
Purchase Details
Closed on
Oct 15, 1993
Sold by
Farrell Darlene Mary Ellen and Mcgee James Edward
Bought by
Basso Gino Mario and Moser Sonya Christine
Home Financials for this Owner
Home Financials are based on the most recent Mortgage that was taken out on this home.
Original Mortgage
$95,200
Interest Rate
6.81%
Create a Home Valuation Report for This Property
The Home Valuation Report is an in-depth analysis detailing your home's value as well as a comparison with similar homes in the area
Home Values in the Area
Average Home Value in this Area
Purchase History
| Date | Buyer | Sale Price | Title Company |
|---|---|---|---|
| Basso Gino | -- | None Available | |
| Basso Gino Mario | -- | Financial Title Company | |
| Basso Gino Mario | $119,000 | North American Title Company |
Source: Public Records
Mortgage History
| Date | Status | Borrower | Loan Amount |
|---|---|---|---|
| Closed | Basso Gino Mario | $125,000 | |
| Closed | Basso Gino Mario | $95,200 |
Source: Public Records
Tax History Compared to Growth
Tax History
| Year | Tax Paid | Tax Assessment Tax Assessment Total Assessment is a certain percentage of the fair market value that is determined by local assessors to be the total taxable value of land and additions on the property. | Land | Improvement |
|---|---|---|---|---|
| 2025 | $2,352 | $202,226 | $59,470 | $142,756 |
| 2024 | $2,352 | $198,261 | $58,304 | $139,957 |
| 2023 | $2,304 | $194,374 | $57,161 | $137,213 |
| 2022 | $2,273 | $190,564 | $56,041 | $134,523 |
| 2021 | $2,227 | $186,829 | $54,943 | $131,886 |
| 2020 | $2,212 | $184,914 | $54,380 | $130,534 |
| 2019 | $2,175 | $181,289 | $53,314 | $127,975 |
| 2018 | $2,118 | $177,735 | $52,269 | $125,466 |
| 2017 | $2,063 | $174,251 | $51,245 | $123,006 |
| 2016 | $2,016 | $170,836 | $50,241 | $120,595 |
| 2015 | $1,914 | $168,271 | $49,487 | $118,784 |
| 2014 | $2,036 | $164,976 | $48,518 | $116,458 |
Source: Public Records
Map
Nearby Homes
- 10583 Home Ranch Ct
- 10465 Rugby Ct
- 2129 Danbury Way
- 2171 River Vista Way
- 2266 River Trails Cir
- 2413 Cordova Ln
- 2329 Mcgregor Dr
- 2701 Zinfandel Dr
- 10361 Daniel Way
- 10825 Walnutwood Way
- 2404 Coolidge Way
- 2746 Aramon Dr
- 2352 Sonata Dr
- 2644 Tronero Way
- 2600 Garrett Way
- 2337 Benita Dr
- 10835 Coloma Rd Unit 3
- 2256 Ramo Ct
- 2255 El Manto Dr
- 1977 Benita Dr Unit 1
- 2322 Walnut Grove Way
- 2314 Walnut Grove Way
- 2326 Walnut Grove Way
- 2310 Walnut Grove Way
- 10428 Wood Bridge Way
- 2330 Walnut Grove Way
- 2321 Walnut Grove Way
- 2317 Walnut Grove Way
- 2325 Walnut Grove Way
- 2300 Walnut Grove Way
- 2313 Walnut Grove Way
- 10424 Wood Bridge Way
- 2329 Walnut Grove Way
- 2334 Walnut Grove Way
- 2305 Walnut Grove Way
- 10420 Wood Bridge Way
- 2338 Walnut Grove Way
- 2320 Pecan Grove Way
- 2316 Pecan Grove Way
- 2337 Walnut Grove Way