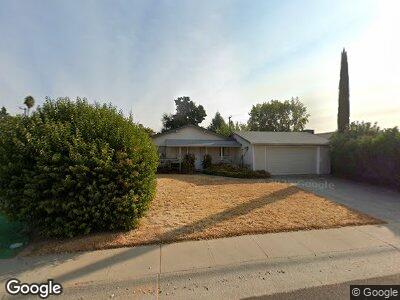
2321 Rosado Way Rancho Cordova, CA 95670
Walnut Wood NeighborhoodEstimated Value: $424,000 - $437,000
3
Beds
2
Baths
1,242
Sq Ft
$345/Sq Ft
Est. Value
About This Home
This home is located at 2321 Rosado Way, Rancho Cordova, CA 95670 and is currently estimated at $428,954, approximately $345 per square foot. 2321 Rosado Way is a home located in Sacramento County with nearby schools including Williamson Elementary School, W.E. Mitchell Middle School, and Cordova High School.
Ownership History
Date
Name
Owned For
Owner Type
Purchase Details
Closed on
Jun 6, 2011
Sold by
Zawilski Czeslaw and Rosinska Helena
Bought by
Rosinska Helena
Current Estimated Value
Purchase Details
Closed on
Jun 2, 2011
Sold by
Rosinska Helena
Bought by
Rosinska Helena and Rosinska Anna M
Purchase Details
Closed on
Mar 6, 2002
Sold by
Mouras Belton
Bought by
Zawilski Czeslaw and Rosinska Helena
Purchase Details
Closed on
Apr 15, 1999
Sold by
Powers Rita Claire and Powers Rita Claire Trust
Bought by
Mouras Belton
Home Financials for this Owner
Home Financials are based on the most recent Mortgage that was taken out on this home.
Original Mortgage
$25,000
Interest Rate
6.94%
Mortgage Type
Unknown
Purchase Details
Closed on
Dec 2, 1994
Sold by
Powers Thomas A and Powers Rita C
Bought by
Powers Rita Claire and The Rita Claire Powers Trust
Create a Home Valuation Report for This Property
The Home Valuation Report is an in-depth analysis detailing your home's value as well as a comparison with similar homes in the area
Home Values in the Area
Average Home Value in this Area
Purchase History
| Date | Buyer | Sale Price | Title Company |
|---|---|---|---|
| Rosinska Helena | -- | None Available | |
| Zawilski Czeslaw | $155,000 | Fidelity National Title Co | |
| Mouras Belton | -- | Fidelity National Title Co | |
| Powers Rita Claire | -- | -- |
Source: Public Records
Mortgage History
| Date | Status | Borrower | Loan Amount |
|---|---|---|---|
| Previous Owner | Mouras Belton | $40,000 | |
| Previous Owner | Mouras Belton | $10,000 | |
| Previous Owner | Mouras Belton | $25,000 | |
| Previous Owner | Mouras Belton | $68,000 |
Source: Public Records
Tax History Compared to Growth
Tax History
| Year | Tax Paid | Tax Assessment Tax Assessment Total Assessment is a certain percentage of the fair market value that is determined by local assessors to be the total taxable value of land and additions on the property. | Land | Improvement |
|---|---|---|---|---|
| 2024 | $2,723 | $224,468 | $61,542 | $162,926 |
| 2023 | $2,669 | $220,068 | $60,336 | $159,732 |
| 2022 | $2,635 | $215,753 | $59,153 | $156,600 |
| 2021 | $2,584 | $211,524 | $57,994 | $153,530 |
| 2020 | $2,567 | $209,356 | $57,400 | $151,956 |
| 2019 | $2,526 | $205,252 | $56,275 | $148,977 |
| 2018 | $2,461 | $201,228 | $55,172 | $146,056 |
| 2017 | $2,399 | $197,284 | $54,091 | $143,193 |
| 2016 | $2,355 | $193,417 | $53,031 | $140,386 |
| 2015 | $2,235 | $190,513 | $52,235 | $138,278 |
| 2014 | $2,295 | $179,889 | $49,322 | $130,567 |
Source: Public Records
Map
Nearby Homes
- 2333 Pinturo Way
- 2363 Mcgregor Dr
- 2499 Knightwood Way
- 2329 Mcgregor Dr
- 2462 Stokewood Way
- 2301 Mcgregor Dr
- 2344 Bridlewood Dr Unit 36
- 10807 Coloma Rd Unit 4
- 10803 Coloma Rd Unit 2
- 10849 Coloma Rd Unit 2
- 1977 Benita Dr Unit 4
- 10980 Hirschfeld Way
- 11028 Winterwind Ln
- 2476 Glenfaire Dr
- 2020 Benita Dr Unit 1
- 2420 Glenfaire Dr
- 2006 Zinfandel Dr Unit 68
- 11078 Autumnwind Ln
- 2448 Rashawn Dr
- 11066 Autumnwind Ln
- 2321 Rosado Way
- 2317 Rosado Way
- 2325 Rosado Way
- 2340 Benita Dr
- 2336 Benita Dr
- 2313 Rosado Way
- 2329 Rosado Way
- 2344 Benita Dr
- 2332 Benita Dr
- 2316 Rosado Way
- 2324 Rosado Way
- 2309 Rosado Way
- 2333 Rosado Way
- 2348 Benita Dr
- 2328 Benita Dr
- 2312 Rosado Way
- 2328 Rosado Way
- 2308 Rosado Way
- 2352 Benita Dr
- 2324 Benita Dr