
Seller Co-Listing Agent in 2022
Joelle Addante
Compass
(602) 790-6484
102 in this area
156 Total Sales
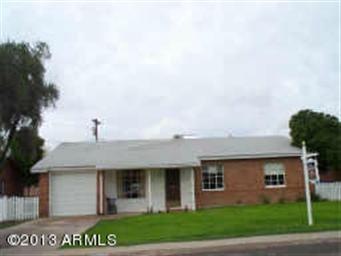
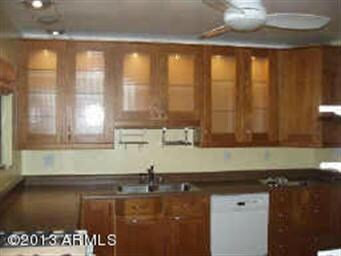
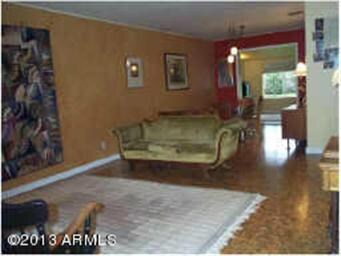
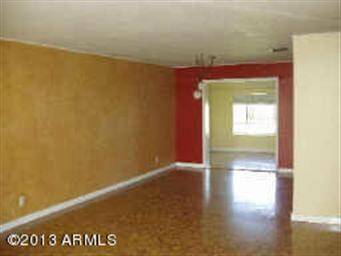
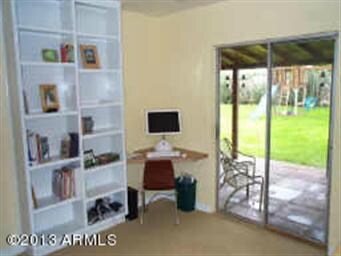
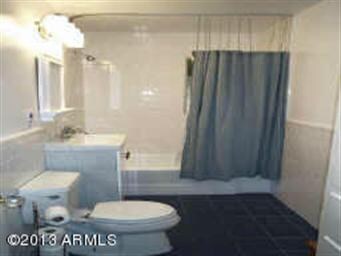
Great investor opportunity near Biltmore area. Not a foreclosure or short sale. Very clean interior and good size lot on a sprinkler system. Remodeled kitchen and baths with high tech lighting. Property being sold AS-IS no SPDS or CLUE report. Owner has never occupied the property. AS-IS addendum to be included with offer to purchase.
Last Agent to Sell the Property
Guardian Realty & Mgmt, Inc License #SA018251000 Listed on: 06/01/2013
| Date | Type | Sale Price | Title Company |
|---|---|---|---|
| Warranty Deed | $568,500 | Chicago Title | |
| Warranty Deed | $620,000 | Chicago Title Agency | |
| Warranty Deed | $260,000 | First Arizona Title Agency | |
| Warranty Deed | -- | Accommodation | |
| Cash Sale Deed | $188,000 | Sterling Title Agency Llc | |
| Interfamily Deed Transfer | -- | -- | |
| Warranty Deed | $209,900 | Westland Title Agency Of Az | |
| Warranty Deed | $130,000 | Fidelity National Title | |
| Interfamily Deed Transfer | -- | -- | |
| Interfamily Deed Transfer | -- | -- |
| Date | Status | Loan Amount | Loan Type |
|---|---|---|---|
| Open | $454,800 | New Conventional | |
| Previous Owner | $416,000 | New Conventional | |
| Previous Owner | $218,000 | New Conventional | |
| Previous Owner | $167,900 | New Conventional | |
| Previous Owner | $104,000 | New Conventional | |
| Closed | $17,500 | No Value Available |
| Date | Event | Price | Change | Sq Ft Price |
|---|---|---|---|---|
| 02/08/2022 02/08/22 | Sold | $568,500 | -1.9% | $359 / Sq Ft |
| 01/10/2022 01/10/22 | Pending | -- | -- | -- |
| 01/07/2022 01/07/22 | Price Changed | $579,500 | -0.9% | $366 / Sq Ft |
| 12/09/2021 12/09/21 | Price Changed | $585,000 | -1.7% | $369 / Sq Ft |
| 11/05/2021 11/05/21 | For Sale | $595,000 | +14.4% | $375 / Sq Ft |
| 02/18/2021 02/18/21 | Sold | $520,000 | 0.0% | $310 / Sq Ft |
| 01/15/2021 01/15/21 | Pending | -- | -- | -- |
| 01/04/2021 01/04/21 | For Sale | $520,000 | +100.0% | $310 / Sq Ft |
| 04/24/2014 04/24/14 | Sold | $260,000 | +0.5% | $155 / Sq Ft |
| 04/23/2014 04/23/14 | Price Changed | $258,790 | 0.0% | $155 / Sq Ft |
| 03/24/2014 03/24/14 | Pending | -- | -- | -- |
| 03/21/2014 03/21/14 | Price Changed | $258,790 | 0.0% | $155 / Sq Ft |
| 02/14/2014 02/14/14 | Price Changed | $258,800 | 0.0% | $155 / Sq Ft |
| 01/31/2014 01/31/14 | Price Changed | $258,900 | -0.1% | $155 / Sq Ft |
| 01/17/2014 01/17/14 | Price Changed | $259,200 | 0.0% | $155 / Sq Ft |
| 01/03/2014 01/03/14 | Price Changed | $259,300 | 0.0% | $155 / Sq Ft |
| 12/20/2013 12/20/13 | Price Changed | $259,400 | 0.0% | $155 / Sq Ft |
| 12/13/2013 12/13/13 | Price Changed | $259,500 | 0.0% | $155 / Sq Ft |
| 12/07/2013 12/07/13 | Price Changed | $259,600 | 0.0% | $155 / Sq Ft |
| 11/23/2013 11/23/13 | Price Changed | $259,700 | -0.1% | $155 / Sq Ft |
| 11/15/2013 11/15/13 | Price Changed | $259,900 | -2.6% | $155 / Sq Ft |
| 11/09/2013 11/09/13 | Price Changed | $266,900 | -0.1% | $159 / Sq Ft |
| 11/02/2013 11/02/13 | Price Changed | $267,300 | 0.0% | $160 / Sq Ft |
| 10/26/2013 10/26/13 | Price Changed | $267,400 | -0.7% | $160 / Sq Ft |
| 10/17/2013 10/17/13 | Price Changed | $269,400 | 0.0% | $161 / Sq Ft |
| 10/04/2013 10/04/13 | Price Changed | $269,500 | 0.0% | $161 / Sq Ft |
| 09/27/2013 09/27/13 | Price Changed | $269,600 | 0.0% | $161 / Sq Ft |
| 09/13/2013 09/13/13 | For Sale | $269,700 | +43.5% | $161 / Sq Ft |
| 06/20/2013 06/20/13 | Sold | $188,000 | +1.6% | $118 / Sq Ft |
| 06/10/2013 06/10/13 | Pending | -- | -- | -- |
| 06/01/2013 06/01/13 | For Sale | $185,000 | -- | $116 / Sq Ft |
| Year | Tax Paid | Tax Assessment Tax Assessment Total Assessment is a certain percentage of the fair market value that is determined by local assessors to be the total taxable value of land and additions on the property. | Land | Improvement |
|---|---|---|---|---|
| 2025 | $2,978 | $23,982 | -- | -- |
| 2024 | $2,904 | $22,840 | -- | -- |
| 2023 | $2,904 | $39,200 | $7,840 | $31,360 |
| 2022 | $2,818 | $30,920 | $6,180 | $24,740 |
| 2021 | $2,512 | $27,980 | $5,590 | $22,390 |
| 2020 | $2,471 | $25,600 | $5,120 | $20,480 |
| 2019 | $2,415 | $23,650 | $4,730 | $18,920 |
| 2018 | $2,352 | $22,610 | $4,520 | $18,090 |
| 2017 | $2,233 | $20,210 | $4,040 | $16,170 |
| 2016 | $2,152 | $19,060 | $3,810 | $15,250 |
| 2015 | $2,002 | $17,620 | $3,520 | $14,100 |
Seller Co-Listing Agent in 2022
Joelle Addante
Compass
(602) 790-6484
102 in this area
156 Total Sales
Buyer's Agent in 2022
Trevor Halpern
eXp Realty
(602) 595-4200
37 in this area
188 Total Sales
Seller's Agent in 2021
Lisa Garvey
HomeSmart Realty
(623) 326-2607
1 in this area
27 Total Sales
Buyer's Agent in 2021
David Thayer
Compass
(646) 280-8158
68 in this area
122 Total Sales
C
Seller's Agent in 2014
Casey Block
TPH Zerodown Brokerage
C
Buyer's Agent in 2014
Chris Forrester
HomeSmart
Source: Arizona Regional Multiple Listing Service (ARMLS)
MLS Number: 4948900
APN: 163-34-059
Disclaimer: Certain information contained herein is derived from information provided by parties other than Homes.com. All information provided is deemed reliable, but is not guaranteed to be accurate and should be independently verified.
![]() All information should be verified by the recipient and none is guaranteed as accurate by ARMLS
All information should be verified by the recipient and none is guaranteed as accurate by ARMLS
Listing Information presented by local MLS brokerage: Ten-X, local REALTOR®- Arlene Richardson - (888)-952-6393