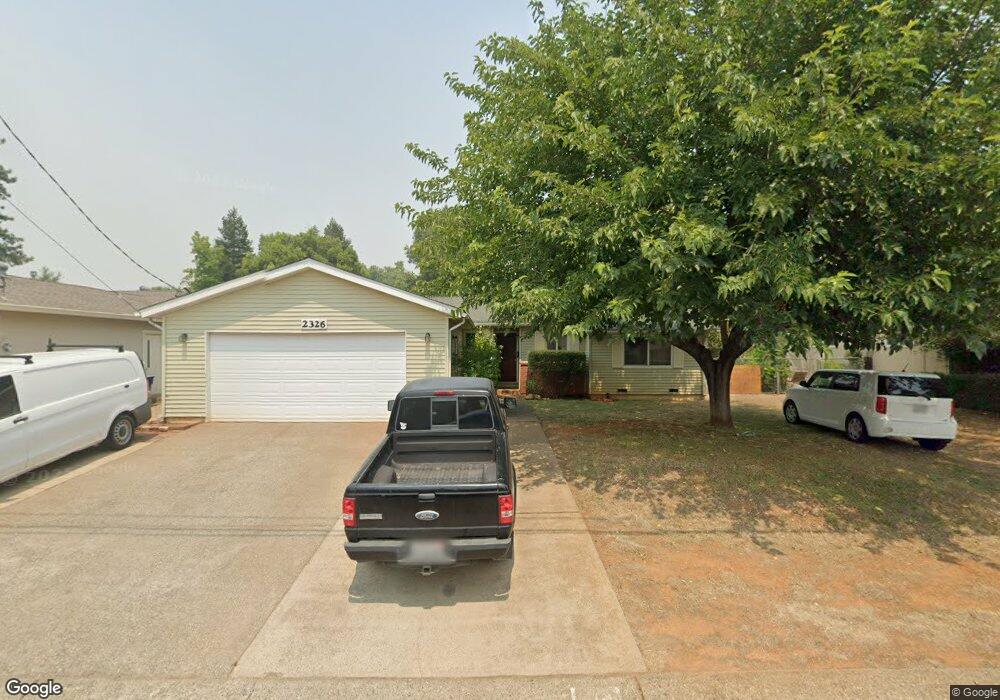
2326 Jonquil Way Redding, CA 96002
Shasta View NeighborhoodEstimated Value: $278,078 - $309,000
3
Beds
2
Baths
1,278
Sq Ft
$235/Sq Ft
Est. Value
About This Home
This home is located at 2326 Jonquil Way, Redding, CA 96002 and is currently estimated at $299,770, approximately $234 per square foot. 2326 Jonquil Way is a home located in Shasta County with nearby schools including Shasta Meadows Elementary School, Parsons Junior High School, and Enterprise High School.
Ownership History
Date
Name
Owned For
Owner Type
Purchase Details
Closed on
May 8, 2019
Sold by
Canaday Sharon J
Bought by
Canday Virgil D and Canday Sharon J
Current Estimated Value
Purchase Details
Closed on
Sep 7, 2018
Sold by
Canaday Sharon J and The Hendrich Family Trust
Bought by
Canaday Sharon J
Purchase Details
Closed on
Dec 18, 2014
Sold by
Hendrich Daniel and Hendrich Shirley M
Bought by
The Hendrich Family Trust and Hendrich Shirley M
Purchase Details
Closed on
Jun 3, 1999
Sold by
Shirley Tr Hendrich Family Trust Hendrich Dan
Bought by
Hendrich Daniel and Hendrich Shirley M
Home Financials for this Owner
Home Financials are based on the most recent Mortgage that was taken out on this home.
Original Mortgage
$15,600
Interest Rate
6.5%
Mortgage Type
Stand Alone Second
Create a Home Valuation Report for This Property
The Home Valuation Report is an in-depth analysis detailing your home's value as well as a comparison with similar homes in the area
Home Values in the Area
Average Home Value in this Area
Purchase History
| Date | Buyer | Sale Price | Title Company |
|---|---|---|---|
| Canday Virgil D | -- | None Available | |
| Canaday Sharon J | -- | None Available | |
| The Hendrich Family Trust | -- | None Available | |
| Hendrich Daniel | -- | Fidelity National Title |
Source: Public Records
Mortgage History
| Date | Status | Borrower | Loan Amount |
|---|---|---|---|
| Closed | Hendrich Daniel | $15,600 |
Source: Public Records
Tax History
| Year | Tax Paid | Tax Assessment Tax Assessment Total Assessment is a certain percentage of the fair market value that is determined by local assessors to be the total taxable value of land and additions on the property. | Land | Improvement |
|---|---|---|---|---|
| 2025 | $736 | $71,274 | $10,930 | $60,344 |
| 2024 | $686 | $70,564 | $10,716 | $59,848 |
| 2023 | $686 | $65,740 | $10,506 | $55,234 |
| 2022 | $665 | $64,451 | $10,300 | $54,151 |
| 2021 | $641 | $63,189 | $10,099 | $53,090 |
| 2020 | $637 | $62,542 | $9,996 | $52,546 |
| 2019 | $630 | $61,316 | $9,800 | $51,516 |
| 2018 | $621 | $60,114 | $9,608 | $50,506 |
| 2017 | $629 | $58,936 | $9,420 | $49,516 |
| 2016 | $588 | $57,782 | $9,236 | $48,546 |
| 2015 | $582 | $56,915 | $9,098 | $47,817 |
| 2014 | $577 | $55,801 | $8,920 | $46,881 |
Source: Public Records
Map
Nearby Homes
- 2455 Belladonna St
- 2728 Jasmine Way
- 3072 Alta Mesa Dr
- 2571 Erin Ln
- 3051 Leonard St
- 2681 Hartnell Ave
- 0 Shasta View Unit 25-1945
- 2687 Wilson Ave
- 2976 West Way
- 3594 Laramie St
- 2867 Camulos Way
- 3341 Timbercreek Dr
- 3512 Capricorn Way
- 3425 Silverwood St
- 1701 E Cypress Ave
- 2068 Solar Way
- 3466 Silverwood St
- 3528 Silverwood St
- 1890 Manchester Dr
- 2906 Regal Ave
- 2314 Jonquil Way
- 2340 Jonquil Way
- 2325 Hawn Ave
- 2300 Jonquil Way
- 2313 Hawn Ave
- 2341 Hawn Ave
- 2341 Jonquil Way
- 2325 Jonquil Way
- 2301 Hawn Ave
- 2313 Jonquil Way
- 2366 Jonquil Way
- 2286 Jonquil Way
- 2353 Jonquil Way
- 2301 Jonquil Way
- 2365 Hawn Ave
- 2285 Hawn Ave
- 2378 Jonquil Way
- 2365 Jonquil Way Unit 1
- 2365 Jonquil Way
- 2274 Jonquil Way
Your Personal Tour Guide
Ask me questions while you tour the home.