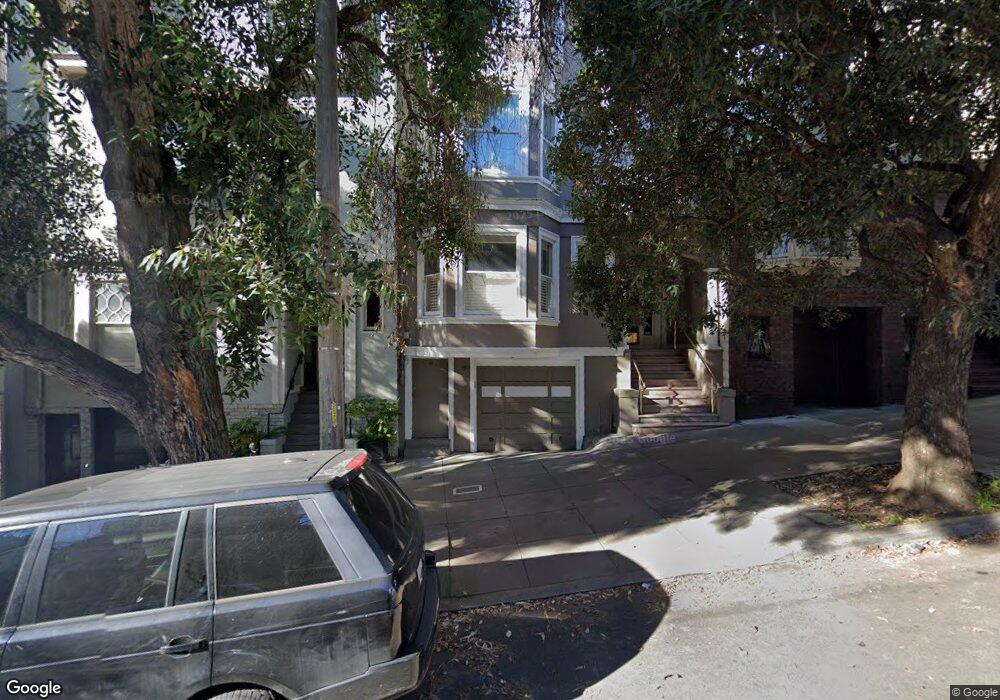
2329 Divisadero St Unit 3 San Francisco, CA 94115
Pacific Heights NeighborhoodEstimated Value: $1,071,000 - $1,259,000
2
Beds
1
Bath
1,150
Sq Ft
$1,020/Sq Ft
Est. Value
About This Home
This home is located at 2329 Divisadero St Unit 3, San Francisco, CA 94115 and is currently estimated at $1,172,460, approximately $1,019 per square foot. 2329 Divisadero St Unit 3 is a home located in San Francisco County with nearby schools including Cobb (William L.) Elementary School, Roosevelt Middle School, and San Francisco Waldorf School.
Ownership History
Date
Name
Owned For
Owner Type
Purchase Details
Closed on
Oct 24, 2012
Sold by
Speer Angela
Bought by
Speer Angela
Current Estimated Value
Home Financials for this Owner
Home Financials are based on the most recent Mortgage that was taken out on this home.
Original Mortgage
$252,000
Outstanding Balance
$173,843
Interest Rate
3.43%
Mortgage Type
New Conventional
Estimated Equity
$998,617
Purchase Details
Closed on
Dec 24, 2003
Sold by
Speer Angela
Bought by
Speer Angela
Purchase Details
Closed on
Oct 20, 2002
Sold by
Murphy David J
Bought by
Speer Angela
Home Financials for this Owner
Home Financials are based on the most recent Mortgage that was taken out on this home.
Original Mortgage
$285,000
Interest Rate
5.99%
Create a Home Valuation Report for This Property
The Home Valuation Report is an in-depth analysis detailing your home's value as well as a comparison with similar homes in the area
Home Values in the Area
Average Home Value in this Area
Purchase History
| Date | Buyer | Sale Price | Title Company |
|---|---|---|---|
| Speer Angela | -- | First American Title Company | |
| Speer Angela | -- | First American Title Company | |
| Speer Angela | -- | -- | |
| Speer Angela | $585,000 | First American Title Company |
Source: Public Records
Mortgage History
| Date | Status | Borrower | Loan Amount |
|---|---|---|---|
| Open | Speer Angela | $252,000 | |
| Closed | Speer Angela | $285,000 |
Source: Public Records
Tax History Compared to Growth
Tax History
| Year | Tax Paid | Tax Assessment Tax Assessment Total Assessment is a certain percentage of the fair market value that is determined by local assessors to be the total taxable value of land and additions on the property. | Land | Improvement |
|---|---|---|---|---|
| 2025 | $9,845 | $847,256 | $423,628 | $423,628 |
| 2024 | $9,845 | $830,644 | $415,322 | $415,322 |
| 2023 | $9,682 | $814,358 | $407,179 | $407,179 |
| 2022 | $9,502 | $798,392 | $399,196 | $399,196 |
| 2021 | $9,338 | $782,738 | $391,369 | $391,369 |
| 2020 | $9,366 | $774,712 | $387,356 | $387,356 |
| 2019 | $9,046 | $759,522 | $379,761 | $379,761 |
| 2018 | $8,744 | $744,630 | $372,315 | $372,315 |
| 2017 | $8,641 | $730,030 | $365,015 | $365,015 |
| 2016 | $8,490 | $715,716 | $357,858 | $357,858 |
| 2015 | $8,387 | $704,966 | $352,483 | $352,483 |
| 2014 | $8,167 | $691,158 | $345,579 | $345,579 |
Source: Public Records
Map
Nearby Homes
- 2800 Pacific Ave
- 2830 Pacific Ave
- 2221 Scott St
- 2725 Broadway St
- 2945 Pacific Ave Unit 9
- 2121 Divisadero St
- 2990 Jackson St Unit 4
- 2033 Broderick St
- 2025 Broderick St Unit 6
- 2854 Sacramento St
- 2046 Divisadero St
- 3124 Washington St
- 2735 Clay St Unit 1
- 1910 Baker St
- 2051 Scott St Unit 101
- 2833 Vallejo St
- 2898 Broadway St
- 3062 Jackson St
- 2881 Vallejo St
- 2546 Jackson St
- 2329 Divisadero St Unit 6
- 2329 Divisadero St Unit 5
- 2329 Divisadero St Unit 4
- 2329 Divisadero St Unit 1
- 2327 Divisadero St
- 2325 Divisadero St Unit 2325
- 2323 Divisadero St Unit 2323
- 2345 Divisadero St
- 2315 Divisadero St Unit B
- 2315 Divisadero St Unit T
- 2315 Divisadero St Unit N
- 2315 Divisadero St Unit U
- 2315 Divisadero St Unit S
- 2315 Divisadero St Unit O
- 2315 Divisadero St Unit M
- 2315 Divisadero St Unit C
- 2315B Divisadero St Unit B
- 2315 Divisadero St Unit A
- 2309 Divisadero St
- 2309 Divisadero St Unit 1