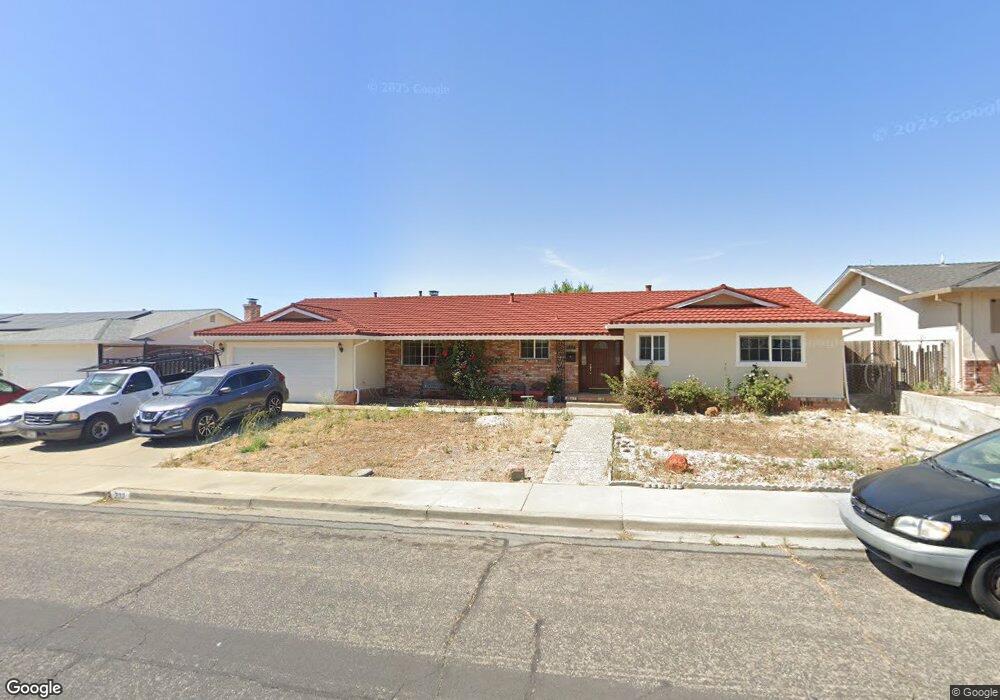
233 Boulder Dr Antioch, CA 94509
Deer Valley NeighborhoodEstimated Value: $597,000 - $663,000
3
Beds
2
Baths
1,877
Sq Ft
$330/Sq Ft
Est. Value
About This Home
This home is located at 233 Boulder Dr, Antioch, CA 94509 and is currently estimated at $619,582, approximately $330 per square foot. 233 Boulder Dr is a home located in Contra Costa County with nearby schools including John Muir Elementary School, Dallas Ranch Middle School, and Deer Valley High School.
Ownership History
Date
Name
Owned For
Owner Type
Purchase Details
Closed on
Feb 25, 2015
Sold by
Robinett Luana Lee
Bought by
Vera Danielle and Vera Vincent
Current Estimated Value
Home Financials for this Owner
Home Financials are based on the most recent Mortgage that was taken out on this home.
Original Mortgage
$240,000
Outstanding Balance
$183,271
Interest Rate
3.6%
Mortgage Type
New Conventional
Estimated Equity
$436,311
Purchase Details
Closed on
Feb 6, 2013
Sold by
Billeci Horace Frank
Bought by
Billeci Horace Frank and Billeci Luana Lee
Purchase Details
Closed on
Feb 12, 2004
Sold by
Billeci Horace Frank and Billeci Shirley M
Bought by
Billeci Horace Frank and Billeci Shirley Mae
Purchase Details
Closed on
Jan 29, 1999
Sold by
Billeci Horace Frank
Bought by
Billeci Horace Frank and Billeci Shirley M
Purchase Details
Closed on
Dec 30, 1998
Sold by
Billeci Salvatore John 1990 Family Trust and Frank Horace Frank
Bought by
Billeci Horace Frank
Create a Home Valuation Report for This Property
The Home Valuation Report is an in-depth analysis detailing your home's value as well as a comparison with similar homes in the area
Home Values in the Area
Average Home Value in this Area
Purchase History
| Date | Buyer | Sale Price | Title Company |
|---|---|---|---|
| Vera Danielle | $300,000 | Old Republic Title Company | |
| Billeci Horace Frank | -- | None Available | |
| Billeci Horace Frank | -- | -- | |
| Billeci Horace Frank | -- | -- | |
| Billeci Horace Frank | -- | -- |
Source: Public Records
Mortgage History
| Date | Status | Borrower | Loan Amount |
|---|---|---|---|
| Open | Vera Danielle | $240,000 |
Source: Public Records
Tax History
| Year | Tax Paid | Tax Assessment Tax Assessment Total Assessment is a certain percentage of the fair market value that is determined by local assessors to be the total taxable value of land and additions on the property. | Land | Improvement |
|---|---|---|---|---|
| 2025 | $4,606 | $360,544 | $84,124 | $276,420 |
| 2024 | $4,374 | $353,475 | $82,475 | $271,000 |
| 2023 | $4,374 | $346,545 | $80,858 | $265,687 |
| 2022 | $4,307 | $339,751 | $79,273 | $260,478 |
| 2021 | $4,138 | $333,090 | $77,719 | $255,371 |
| 2019 | $4,089 | $323,213 | $75,415 | $247,798 |
| 2018 | $3,946 | $316,877 | $73,937 | $242,940 |
| 2017 | $3,848 | $310,665 | $72,488 | $238,177 |
| 2016 | $3,763 | $304,574 | $71,067 | $233,507 |
| 2015 | $1,283 | $82,071 | $21,387 | $60,684 |
| 2014 | $1,240 | $80,465 | $20,969 | $59,496 |
Source: Public Records
Map
Nearby Homes
- 224 Cobblestone Dr
- 3937 Pebble Dr
- 318 Redrock Dr
- 3504 Alberti Ct
- 3508 Alberti Ct
- 26 El Capitan Ln
- 108 Fleetwood Dr
- 14 El Capitan Ln
- 3405 Garrow Dr
- 9 El Capitan Ln
- 924 Flintrock Dr
- 3218 Westbourne Dr
- 3419 Barmouth Dr
- 3613 Longview Rd
- 941 Bluerock Dr
- 4729 Matterhorn Ct
- 18 Danridge Ct
- 1009 Flintrock Dr
- 5 Terranova Dr
- 4109 S Royal Links Cir
- 239 Boulder Dr
- 229 Boulder Dr
- 225 Boulder Dr
- 243 Boulder Dr
- 236 Boulder Dr
- 240 Boulder Dr
- 228 Boulder Dr
- 244 Boulder Dr
- 247 Boulder Dr
- 221 Boulder Dr
- 220 Cobblestone Dr
- 224 Boulder Dr
- 216 Cobblestone Dr
- 3900 Pebble Dr
- 212 Cobblestone Dr
- 301 Boulder Dr
- 220 Boulder Dr
- 217 Boulder Dr
- 3906 Pebble Dr
- 208 Cobblestone Dr
Your Personal Tour Guide
Ask me questions while you tour the home.