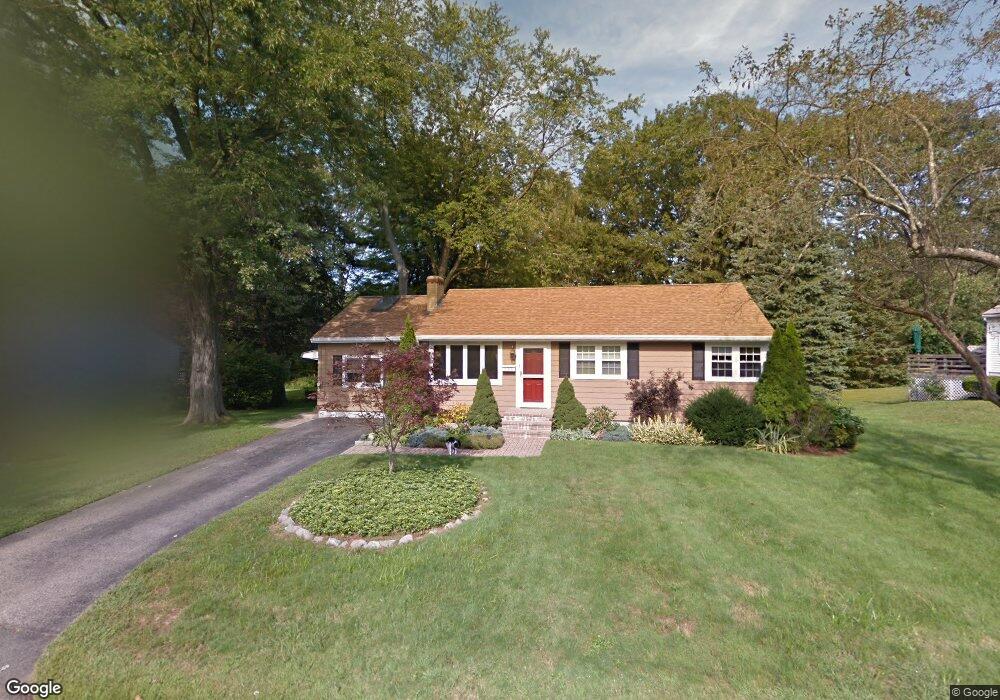
233 Edgewater Dr Framingham, MA 01702
Estimated Value: $588,000 - $688,000
3
Beds
1
Bath
1,541
Sq Ft
$409/Sq Ft
Est. Value
About This Home
This home is located at 233 Edgewater Dr, Framingham, MA 01702 and is currently estimated at $629,705, approximately $408 per square foot. 233 Edgewater Dr is a home located in Middlesex County with nearby schools including Framingham High School, Saint Bridget School, and Happy Hollow School.
Ownership History
Date
Name
Owned For
Owner Type
Purchase Details
Closed on
Aug 28, 2019
Sold by
Jenkins Jane E
Bought by
Jenkins Lt and Jenkins
Current Estimated Value
Purchase Details
Closed on
Jun 15, 2011
Sold by
Coen Shaun P and Coen Patricia A
Bought by
Jenkins Jane E
Home Financials for this Owner
Home Financials are based on the most recent Mortgage that was taken out on this home.
Original Mortgage
$251,000
Interest Rate
4.74%
Mortgage Type
Purchase Money Mortgage
Purchase Details
Closed on
Jul 24, 1998
Sold by
Coen Lawrence R
Bought by
Coen Shaun P and Lentini Patricia
Home Financials for this Owner
Home Financials are based on the most recent Mortgage that was taken out on this home.
Original Mortgage
$156,750
Interest Rate
6.99%
Mortgage Type
Purchase Money Mortgage
Purchase Details
Closed on
Jul 17, 1987
Sold by
Oconnell John E
Bought by
Coen Lawrence R
Create a Home Valuation Report for This Property
The Home Valuation Report is an in-depth analysis detailing your home's value as well as a comparison with similar homes in the area
Home Values in the Area
Average Home Value in this Area
Purchase History
| Date | Buyer | Sale Price | Title Company |
|---|---|---|---|
| Jenkins Lt | -- | -- | |
| Jenkins Jane E | $340,000 | -- | |
| Jenkins Jane E | $340,000 | -- | |
| Coen Shaun P | $167,000 | -- | |
| Coen Shaun P | $167,000 | -- | |
| Coen Lawrence R | $164,100 | -- |
Source: Public Records
Mortgage History
| Date | Status | Borrower | Loan Amount |
|---|---|---|---|
| Previous Owner | Jenkins Jane E | $251,000 | |
| Previous Owner | Coen Lawrence R | $156,750 |
Source: Public Records
Tax History
| Year | Tax Paid | Tax Assessment Tax Assessment Total Assessment is a certain percentage of the fair market value that is determined by local assessors to be the total taxable value of land and additions on the property. | Land | Improvement |
|---|---|---|---|---|
| 2025 | $7,828 | $655,600 | $330,500 | $325,100 |
| 2024 | $7,467 | $599,300 | $294,800 | $304,500 |
| 2023 | $7,032 | $537,200 | $259,200 | $278,000 |
| 2022 | $6,660 | $484,700 | $235,300 | $249,400 |
| 2021 | $6,484 | $461,500 | $226,200 | $235,300 |
| 2020 | $6,163 | $411,400 | $183,400 | $228,000 |
| 2019 | $5,726 | $372,300 | $163,400 | $208,900 |
| 2018 | $6,600 | $404,400 | $162,300 | $242,100 |
| 2017 | $6,176 | $369,600 | $136,800 | $232,800 |
| 2016 | $6,217 | $357,700 | $136,800 | $220,900 |
| 2015 | $5,943 | $333,500 | $137,100 | $196,400 |
Source: Public Records
Map
Nearby Homes
- 81 Edgewater Dr
- 12 & 14 Waverly St
- 34 Jodie Rd
- 22 Gryzboska Cir
- 139 Salem End Rd
- 1186 Worcester Rd Unit 610
- 1321 Worcester Rd Unit 603
- 1321 Worcester Rd Unit 201
- 1321 Worcester Rd Unit 610
- 1500 Worcester Rd Unit 221
- 1500 Worcester Rd Unit 118
- 1500 Worcester Rd Unit 426
- 33 Stevens Rd
- 15 Bellmore Rd
- 1116 Waverley
- 1550 Worcester Rd Unit 101
- 45 Daytona Ave
- 10 Rhubena St
- 575 Union Ave Unit 1
- 87 Hilldale Rd
- 223 Edgewater Dr
- 222 Edgewater Dr
- 247 Edgewater Dr
- 215 Edgewater Dr
- 214 Edgewater Dr
- 230 Edgewater Dr
- 18 Fenelon Rd
- 209 Edgewater Dr
- 12 Fenelon Rd
- 238 Edgewater Dr
- 198 Edgewater Dr
- 24 Fenelon Rd
- 30 Fenelon Rd
- 203 Edgewater Dr
- 190 Edgewater Dr
- 36 Fenelon Rd
- 50 Ardmore Rd
- 182 Edgewater Dr
- 40 Ardmore Rd
- 60 Ardmore Rd
Your Personal Tour Guide
Ask me questions while you tour the home.