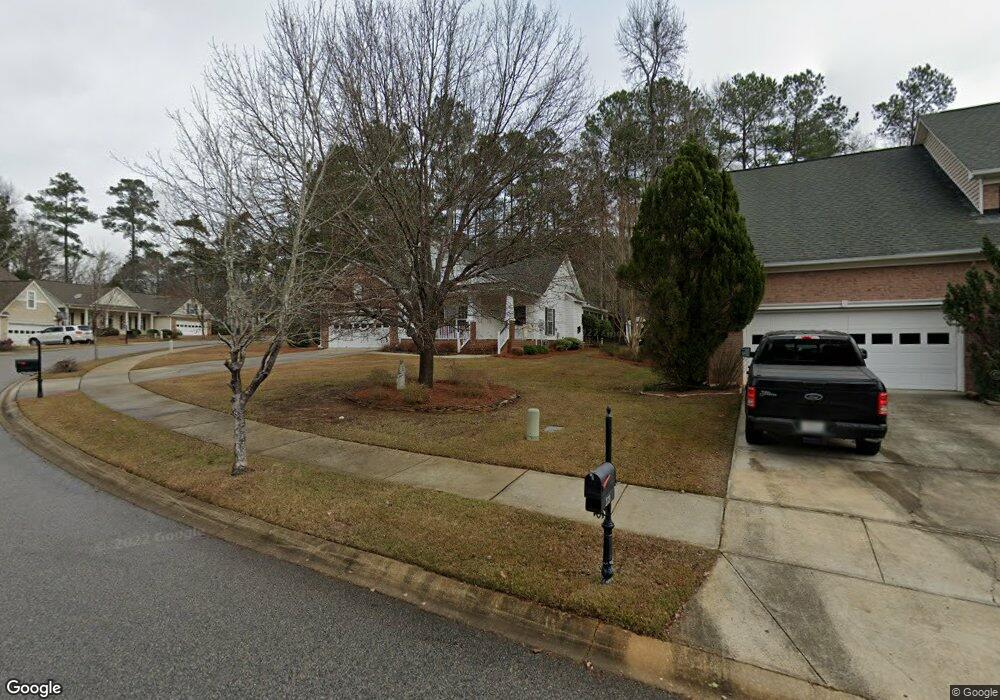
233 Winterberry Loop Lexington, SC 29072
Estimated Value: $302,000 - $362,000
3
Beds
3
Baths
1,963
Sq Ft
$173/Sq Ft
Est. Value
About This Home
This home is located at 233 Winterberry Loop, Lexington, SC 29072 and is currently estimated at $338,721, approximately $172 per square foot. 233 Winterberry Loop is a home located in Lexington County with nearby schools including Meadow Glen Elementary, Meadow Glen Middle School, and River Bluff High School.
Ownership History
Date
Name
Owned For
Owner Type
Purchase Details
Closed on
Mar 25, 2025
Sold by
Finley Evelyn M
Bought by
Finley-Lacobelli Revocable Trust and Finley
Current Estimated Value
Purchase Details
Closed on
Jan 26, 2012
Sold by
Sparks Evelyn M
Bought by
Finley Evelyn M
Home Financials for this Owner
Home Financials are based on the most recent Mortgage that was taken out on this home.
Original Mortgage
$115,000
Interest Rate
3.23%
Mortgage Type
Future Advance Clause Open End Mortgage
Purchase Details
Closed on
Oct 27, 2005
Sold by
Mungo Homes Inc
Bought by
Sparks Evelyn M
Home Financials for this Owner
Home Financials are based on the most recent Mortgage that was taken out on this home.
Original Mortgage
$14,900,000
Interest Rate
5.71%
Mortgage Type
Purchase Money Mortgage
Create a Home Valuation Report for This Property
The Home Valuation Report is an in-depth analysis detailing your home's value as well as a comparison with similar homes in the area
Home Values in the Area
Average Home Value in this Area
Purchase History
| Date | Buyer | Sale Price | Title Company |
|---|---|---|---|
| Finley-Lacobelli Revocable Trust | -- | None Listed On Document | |
| Finley Evelyn M | -- | -- | |
| Sparks Evelyn M | $185,823 | -- | |
| Mungo Homes Inc | $32,000 | -- |
Source: Public Records
Mortgage History
| Date | Status | Borrower | Loan Amount |
|---|---|---|---|
| Previous Owner | Finley Evelyn M | $115,000 | |
| Previous Owner | Mungo Homes Inc | $14,900,000 | |
| Previous Owner | Sparks Evelyn M | $120,000 |
Source: Public Records
Tax History Compared to Growth
Tax History
| Year | Tax Paid | Tax Assessment Tax Assessment Total Assessment is a certain percentage of the fair market value that is determined by local assessors to be the total taxable value of land and additions on the property. | Land | Improvement |
|---|---|---|---|---|
| 2024 | $1,498 | $7,878 | $1,580 | $6,298 |
| 2023 | $1,382 | $7,878 | $1,580 | $6,298 |
| 2022 | $1,379 | $7,878 | $1,580 | $6,298 |
| 2020 | $1,409 | $7,878 | $1,580 | $6,298 |
| 2019 | $1,300 | $6,850 | $1,200 | $5,650 |
| 2018 | $1,280 | $6,850 | $1,200 | $5,650 |
| 2017 | $1,249 | $6,850 | $1,200 | $5,650 |
| 2016 | $1,240 | $6,850 | $1,200 | $5,650 |
| 2014 | $1,247 | $7,112 | $1,200 | $5,912 |
| 2013 | -- | $7,110 | $1,200 | $5,910 |
Source: Public Records
Map
Nearby Homes
- 164 Morgan Dr
- 129 Ridgecrest Dr
- 255 Palmer Dr
- 326 Carola Ln
- 139 Swanhaven Dr
- 0 Mineral Springs Rd Unit 560120
- 81 Circleview Dr
- 151 Swanhaven Dr
- 213 Kwanzan Dr
- 105 Berrywood Ct
- 124 Woodside Rd
- Burke Plan at Lauren Park
- Edenton Plan at Lauren Park - Townhomes
- Burlington Plan at Lauren Park - Townhomes
- Dillon Plan at Lauren Park
- Edinburg Plan at Lauren Park
- Clayton Plan at Lauren Park
- Arlington Plan at Lauren Park
- Burton Plan at Lauren Park
- Ellerbe Plan at Lauren Park
- 239 Winterberry Loop
- 205 Winterberry Loop
- 226 Winterberry Loop
- 243 Winterberry Loop
- 201 Winterberry Loop
- 113 Winterberry Loop
- 222 Winterberry Loop
- 218 Winterberry Loop
- 238 Winterberry Loop
- 247 Winterberry Loop
- 234 Winterberry Loop
- 210 Winterberry Loop
- 240 Winterberry Loop
- 214 Winterberry Loop
- 109 Winterberry Loop
- 244 Winterberry Loop
- 232 Winterberry Loop
- 105 Winterberry Loop
- 251 Winterberry Loop
- 204 Winterberry Loop