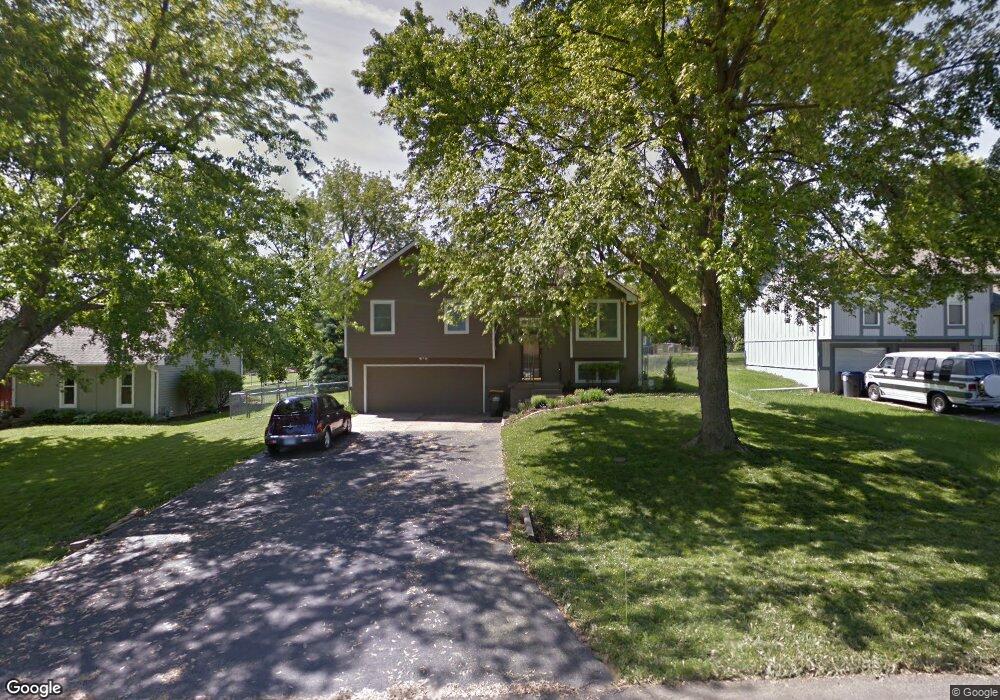
23445 W 53rd Terrace Shawnee, KS 66226
Estimated Value: $319,264 - $342,000
3
Beds
2
Baths
1,196
Sq Ft
$276/Sq Ft
Est. Value
About This Home
This home is located at 23445 W 53rd Terrace, Shawnee, KS 66226 and is currently estimated at $330,566, approximately $276 per square foot. 23445 W 53rd Terrace is a home located in Johnson County with nearby schools including Belmont Elementary School, Mill Creek Middle School, and Mill Valley High School.
Ownership History
Date
Name
Owned For
Owner Type
Purchase Details
Closed on
Dec 20, 2006
Sold by
Deutsche Bank National Trust Co
Bought by
Price David and Price Cathy
Current Estimated Value
Purchase Details
Closed on
Aug 8, 2006
Sold by
Gassen Rachelle and Doe John
Bought by
Deutsche Bank National Trust Co
Purchase Details
Closed on
Jan 31, 2005
Sold by
Gassen Eric and Gassen Rachelle
Bought by
Gassen Rachelle
Home Financials for this Owner
Home Financials are based on the most recent Mortgage that was taken out on this home.
Original Mortgage
$130,400
Interest Rate
6.59%
Mortgage Type
Adjustable Rate Mortgage/ARM
Purchase Details
Closed on
May 8, 2001
Sold by
Gates Ronald G and Gates Darlynne K
Bought by
Gassen Eric and Gassen Rachelle
Home Financials for this Owner
Home Financials are based on the most recent Mortgage that was taken out on this home.
Original Mortgage
$125,882
Interest Rate
6.83%
Mortgage Type
FHA
Create a Home Valuation Report for This Property
The Home Valuation Report is an in-depth analysis detailing your home's value as well as a comparison with similar homes in the area
Home Values in the Area
Average Home Value in this Area
Purchase History
| Date | Buyer | Sale Price | Title Company |
|---|---|---|---|
| Price David | -- | Kansas Title Insurance Corp | |
| Deutsche Bank National Trust Co | $143,774 | Continental Title Co | |
| Gassen Rachelle | -- | Northland Title Servies Llc | |
| Gassen Eric | -- | Security Land Title Company |
Source: Public Records
Mortgage History
| Date | Status | Borrower | Loan Amount |
|---|---|---|---|
| Previous Owner | Gassen Rachelle | $130,400 | |
| Previous Owner | Gassen Eric | $125,882 |
Source: Public Records
Tax History Compared to Growth
Tax History
| Year | Tax Paid | Tax Assessment Tax Assessment Total Assessment is a certain percentage of the fair market value that is determined by local assessors to be the total taxable value of land and additions on the property. | Land | Improvement |
|---|---|---|---|---|
| 2024 | $3,535 | $30,716 | $6,387 | $24,329 |
| 2023 | $3,575 | $30,475 | $6,387 | $24,088 |
| 2022 | $3,487 | $29,107 | $5,548 | $23,559 |
| 2021 | $3,096 | $24,725 | $5,285 | $19,440 |
| 2020 | $2,846 | $22,505 | $5,285 | $17,220 |
| 2019 | $2,645 | $20,596 | $4,601 | $15,995 |
| 2018 | $2,476 | $19,101 | $4,601 | $14,500 |
| 2017 | $2,490 | $18,745 | $4,008 | $14,737 |
| 2016 | $2,391 | $17,768 | $4,008 | $13,760 |
| 2015 | $2,334 | $17,158 | $4,008 | $13,150 |
| 2013 | -- | $15,790 | $4,008 | $11,782 |
Source: Public Records
Map
Nearby Homes
- 5221 Meadow View Dr
- 5625 Meadow View Dr
- 5137 Meadowlark Dr
- 22910 W 51st St
- 5408 Aminda St
- 22605 W 56th St
- 5858 Mccormick Dr
- 22714 W 49th St
- 22625 W 49th St
- 5531 Hilltop Dr
- 5764 Apache Dr
- The Paxton III Plan at Canyon Lakes
- The Sydney III Plan at Canyon Lakes
- The Harlow V Plan at Canyon Lakes
- The Hailey Plan at Canyon Lakes
- The Brooklyn II Plan at Canyon Lakes
- The Niko Plan at Canyon Lakes
- The Payton Plan at Canyon Lakes
- The Aspen Plan at Canyon Lakes
- The Levi II Plan at Canyon Lakes
- 23425 W 53rd Terrace
- 23475 W 53rd Terrace
- 23405 W 53rd Terrace
- 5375 Old K 7 Hwy
- 23440 W 53rd Terrace
- 23385 W 53rd Terrace
- 23420 W 53rd Terrace
- 23470 W 53rd Terrace
- 23400 W 53rd Terrace
- 5323 Kenton Rd
- 5327 Kenton Rd
- 23355 W 53rd Terrace
- 23380 W 53rd Terrace
- 5327 Kenton St
- 5331 Kenton Rd
- 23408 W 54th St
- 23508 W 53rd Terrace
- 23414 W 54th St
- 23400 W 54th St
- 23411 W 52nd Terrace