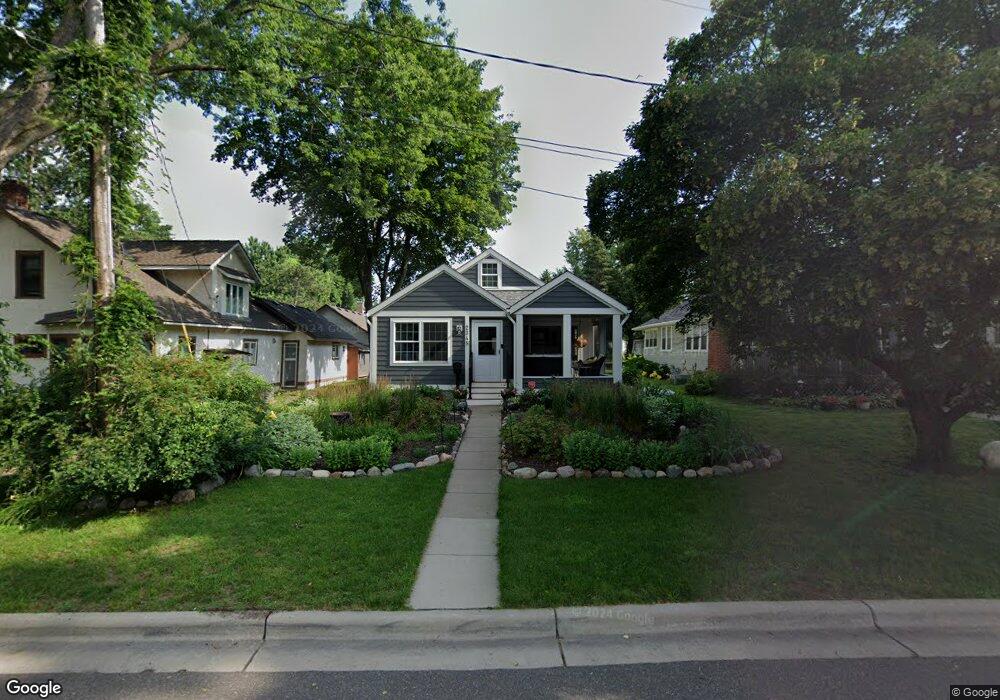
2345 8th St Saint Paul, MN 55110
Estimated Value: $555,000 - $716,000
3
Beds
3
Baths
2,800
Sq Ft
$233/Sq Ft
Est. Value
About This Home
This home is located at 2345 8th St, Saint Paul, MN 55110 and is currently estimated at $652,269, approximately $232 per square foot. 2345 8th St is a home located in Ramsey County with nearby schools including Lakeaires Elementary School, Central Middle School, and Frassati Catholic Academy.
Ownership History
Date
Name
Owned For
Owner Type
Purchase Details
Closed on
Oct 23, 2025
Sold by
Gregory Delwyn M and Gregory Carolyn A
Bought by
Carolyn A Gregory & Delwyn M Gregory Revocabl and Gregory
Current Estimated Value
Purchase Details
Closed on
Sep 18, 2020
Sold by
Warren Joseph W and Warren June M
Bought by
Gregory Carolyn A and Gregory Delwyn M
Home Financials for this Owner
Home Financials are based on the most recent Mortgage that was taken out on this home.
Original Mortgage
$412,000
Interest Rate
2.9%
Mortgage Type
New Conventional
Purchase Details
Closed on
Mar 16, 2007
Sold by
Hanych Kevin G and Hanych Billie Jo
Bought by
Warren Joseph W and Warren June M
Purchase Details
Closed on
Mar 22, 2004
Sold by
Dockendorff Daniel P and Dockendorff Jennifer
Bought by
Hanych Kevin and Hanych Billy Jo
Purchase Details
Closed on
Apr 24, 2001
Sold by
Schmitz Richard P and Schmitz Linda M
Bought by
Dockendorff Daniel P and Dockendorff Jennifer
Purchase Details
Closed on
Mar 6, 2001
Sold by
Cerrenka Candace C and Cerrenka Frank W
Bought by
Schmitz Richard P and Schmitz Linda M
Create a Home Valuation Report for This Property
The Home Valuation Report is an in-depth analysis detailing your home's value as well as a comparison with similar homes in the area
Home Values in the Area
Average Home Value in this Area
Purchase History
| Date | Buyer | Sale Price | Title Company |
|---|---|---|---|
| Carolyn A Gregory & Delwyn M Gregory Revocabl | $500 | None Listed On Document | |
| Gregory Carolyn A | $515,000 | Edina Realty Title Inc | |
| Warren Joseph W | $450,000 | -- | |
| Hanych Kevin | $241,000 | -- | |
| Dockendorff Daniel P | $176,000 | -- | |
| Schmitz Richard P | $172,000 | -- |
Source: Public Records
Mortgage History
| Date | Status | Borrower | Loan Amount |
|---|---|---|---|
| Previous Owner | Gregory Carolyn A | $412,000 |
Source: Public Records
Tax History
| Year | Tax Paid | Tax Assessment Tax Assessment Total Assessment is a certain percentage of the fair market value that is determined by local assessors to be the total taxable value of land and additions on the property. | Land | Improvement |
|---|---|---|---|---|
| 2025 | $7,560 | $680,900 | $110,600 | $570,300 |
| 2023 | $7,560 | $559,200 | $110,600 | $448,600 |
| 2022 | $6,162 | $537,400 | $110,600 | $426,800 |
| 2021 | $5,642 | $458,600 | $110,600 | $348,000 |
| 2020 | $6,584 | $430,400 | $110,600 | $319,800 |
| 2019 | $5,624 | $432,400 | $110,600 | $321,800 |
| 2018 | $4,952 | $385,100 | $110,600 | $274,500 |
| 2017 | $3,722 | $389,200 | $110,600 | $278,600 |
| 2016 | $3,874 | $0 | $0 | $0 |
| 2015 | $4,172 | $316,700 | $100,900 | $215,800 |
| 2014 | $4,170 | $0 | $0 | $0 |
Source: Public Records
Map
Nearby Homes
- 2345 5th St
- 2249 11th St
- 219X 12th St
- 4847 Bloom Ave
- 2199 1st St
- 5129 Wild Marsh Dr
- 5246 Division Ave
- 1961 9th St
- 5285 Northwest Ave
- 4584 Lake Ct
- 1945 4th St
- 5301 Oakwood Dr
- 2676 Stillwater St
- 1962 Florence St
- 1872 4th St
- 1846 7th St
- 5024 Campanaro Ln
- 5253 W Bald Eagle Blvd
- 1848 Highway 96 E
- 4455 Lincoln Ave
Your Personal Tour Guide
Ask me questions while you tour the home.