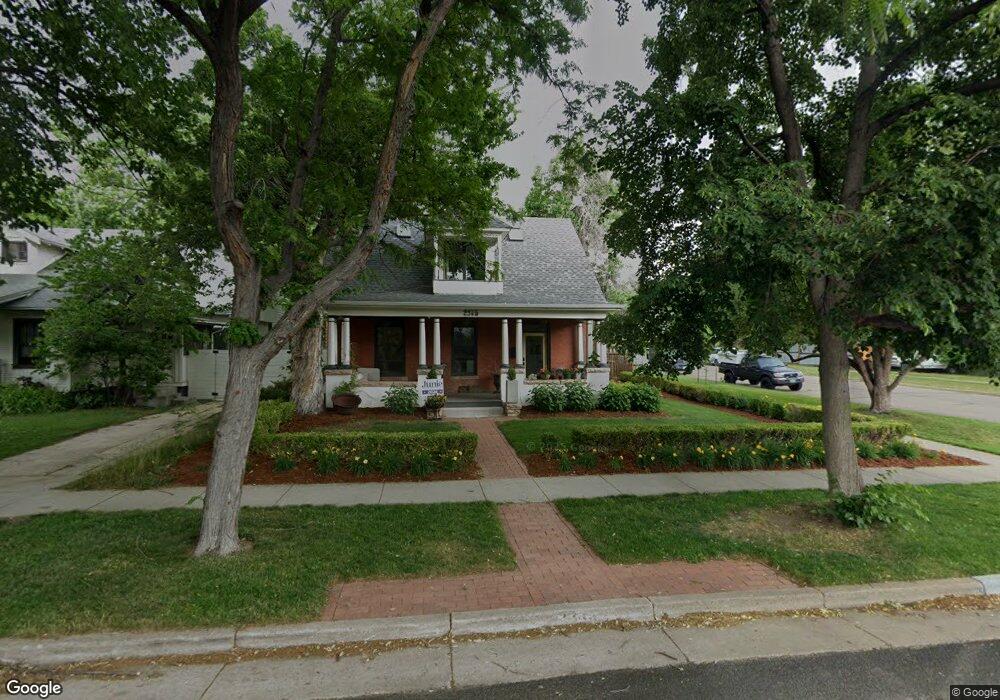
2345 Mapleton Ave Boulder, CO 80304
Whittier NeighborhoodEstimated Value: $1,827,000 - $1,970,000
3
Beds
3
Baths
2,269
Sq Ft
$847/Sq Ft
Est. Value
About This Home
This home is located at 2345 Mapleton Ave, Boulder, CO 80304 and is currently estimated at $1,921,346, approximately $846 per square foot. 2345 Mapleton Ave is a home located in Boulder County with nearby schools including Whittier Elementary School, Casey Middle School, and Boulder High School.
Ownership History
Date
Name
Owned For
Owner Type
Purchase Details
Closed on
Dec 29, 2000
Sold by
Johnson Roy
Bought by
Weakley Mark W
Current Estimated Value
Home Financials for this Owner
Home Financials are based on the most recent Mortgage that was taken out on this home.
Original Mortgage
$538,480
Outstanding Balance
$207,023
Interest Rate
8.12%
Estimated Equity
$1,714,323
Purchase Details
Closed on
Jun 21, 1999
Sold by
Bice Theodore A
Bought by
Johnson Roy
Home Financials for this Owner
Home Financials are based on the most recent Mortgage that was taken out on this home.
Original Mortgage
$300,000
Interest Rate
2.95%
Purchase Details
Closed on
Jun 22, 1989
Bought by
Weakley Mark W and Weakley Phyllis Rogers
Purchase Details
Closed on
Nov 13, 1984
Bought by
Weakley Mark W and Weakley Phyllis Rogers
Create a Home Valuation Report for This Property
The Home Valuation Report is an in-depth analysis detailing your home's value as well as a comparison with similar homes in the area
Home Values in the Area
Average Home Value in this Area
Purchase History
| Date | Buyer | Sale Price | Title Company |
|---|---|---|---|
| Weakley Mark W | $673,100 | -- | |
| Johnson Roy | $375,000 | -- | |
| Weakley Mark W | -- | -- | |
| Weakley Mark W | -- | -- |
Source: Public Records
Mortgage History
| Date | Status | Borrower | Loan Amount |
|---|---|---|---|
| Open | Weakley Mark W | $538,480 | |
| Previous Owner | Johnson Roy | $300,000 |
Source: Public Records
Tax History
| Year | Tax Paid | Tax Assessment Tax Assessment Total Assessment is a certain percentage of the fair market value that is determined by local assessors to be the total taxable value of land and additions on the property. | Land | Improvement |
|---|---|---|---|---|
| 2025 | $12,514 | $131,301 | $70,863 | $60,438 |
| 2024 | $12,514 | $131,301 | $70,863 | $60,438 |
| 2023 | $12,297 | $142,395 | $74,625 | $71,456 |
| 2022 | $10,316 | $111,089 | $58,241 | $52,848 |
| 2021 | $9,837 | $114,286 | $59,917 | $54,369 |
| 2020 | $8,621 | $99,035 | $51,409 | $47,626 |
| 2019 | $8,489 | $99,035 | $51,409 | $47,626 |
| 2018 | $8,015 | $92,441 | $39,456 | $52,985 |
| 2017 | $7,764 | $102,199 | $43,621 | $58,578 |
| 2016 | $7,247 | $83,723 | $34,387 | $49,336 |
| 2015 | $6,863 | $72,811 | $33,114 | $39,697 |
| 2014 | $6,122 | $72,811 | $33,114 | $39,697 |
Source: Public Records
Map
Nearby Homes
- 2240 Bluff St
- 2253 Spruce St Unit 2
- 2336 Spruce St Unit E
- 2120 Folsom St
- 2340 Panorama Ave
- 2515 Bluff St
- 2201 Pearl St Unit 224
- 1916 23rd St Unit 6
- 2317 Walnut St
- 2230 20th St
- 1894 Folsom St
- 2085 Balsam Dr
- 2475 Walnut St
- 2727 Folsom St Unit 303
- 2727 Folsom St Unit 218
- 1938 Spruce St
- 2324 19th St
- 2003 Balsam Dr
- 2711 Mapleton Ave Unit 9
- 2718 Pine St Unit 301
- 2333 Mapleton Ave
- 2323 Mapleton Ave
- 2321 Mapleton Ave
- 2355 24th St
- 2317 Mapleton Ave
- 2319 Mapleton Ave
- 2405 Mapleton Ave
- 2324 Bluff St
- 2328 Bluff St
- 2344 Mapleton Ave
- 2340 Mapleton Ave
- 2313 Mapleton Ave
- 2315 Mapleton Ave
- 2334 Bluff St
- 2404 Bluff St
- 2316 Bluff St
- 2423 Mapleton Ave
- 2318 Mapleton Ave
- 2326 Bluff St
- 2324 Mapleton Ave Unit 2
Your Personal Tour Guide
Ask me questions while you tour the home.