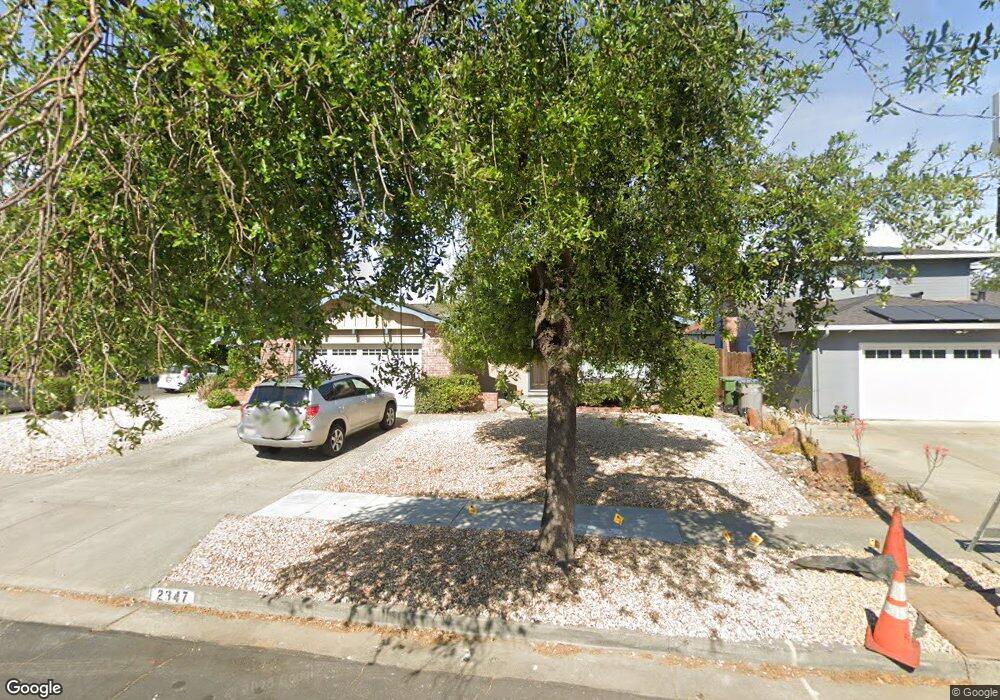
2347 Middletown Dr Campbell, CA 95008
San Tomas Aquinos NeighborhoodEstimated Value: $1,893,000 - $2,254,000
4
Beds
2
Baths
1,512
Sq Ft
$1,417/Sq Ft
Est. Value
About This Home
This home is located at 2347 Middletown Dr, Campbell, CA 95008 and is currently estimated at $2,141,947, approximately $1,416 per square foot. 2347 Middletown Dr is a home located in Santa Clara County with nearby schools including Westmont High School, Forest Hill Elementary School, and Capri Elementary.
Ownership History
Date
Name
Owned For
Owner Type
Purchase Details
Closed on
Jan 29, 2009
Sold by
Brajkovich Joseph M and Brajkovich Stephanie S
Bought by
Brajkovich Joseph M and Brajkovich Stephanie S
Current Estimated Value
Purchase Details
Closed on
Apr 28, 1999
Sold by
Weidman Lorin A and Weidman Nona I
Bought by
Brajkovich Joseph M and Brajkovich Stephanie S
Home Financials for this Owner
Home Financials are based on the most recent Mortgage that was taken out on this home.
Original Mortgage
$310,000
Outstanding Balance
$78,905
Interest Rate
6.86%
Estimated Equity
$2,063,042
Purchase Details
Closed on
Apr 7, 1999
Sold by
Weidman Lorin A and Weidman Nona I
Bought by
Weidman Lorin A and Weidman Nona I
Home Financials for this Owner
Home Financials are based on the most recent Mortgage that was taken out on this home.
Original Mortgage
$310,000
Outstanding Balance
$78,905
Interest Rate
6.86%
Estimated Equity
$2,063,042
Create a Home Valuation Report for This Property
The Home Valuation Report is an in-depth analysis detailing your home's value as well as a comparison with similar homes in the area
Home Values in the Area
Average Home Value in this Area
Purchase History
| Date | Buyer | Sale Price | Title Company |
|---|---|---|---|
| Brajkovich Joseph M | -- | None Available | |
| Brajkovich Joseph M | $410,000 | Old Republic Title Company | |
| Weidman Lorin A | -- | -- |
Source: Public Records
Mortgage History
| Date | Status | Borrower | Loan Amount |
|---|---|---|---|
| Open | Brajkovich Joseph M | $310,000 |
Source: Public Records
Tax History
| Year | Tax Paid | Tax Assessment Tax Assessment Total Assessment is a certain percentage of the fair market value that is determined by local assessors to be the total taxable value of land and additions on the property. | Land | Improvement |
|---|---|---|---|---|
| 2025 | $9,060 | $642,350 | $192,661 | $449,689 |
| 2024 | $9,060 | $629,756 | $188,884 | $440,872 |
| 2023 | $8,875 | $617,409 | $185,181 | $432,228 |
| 2022 | $8,823 | $605,303 | $181,550 | $423,753 |
| 2021 | $8,631 | $593,436 | $177,991 | $415,445 |
| 2020 | $8,392 | $587,352 | $176,166 | $411,186 |
| 2019 | $8,273 | $575,836 | $172,712 | $403,124 |
| 2018 | $8,045 | $564,546 | $169,326 | $395,220 |
| 2017 | $7,940 | $553,477 | $166,006 | $387,471 |
| 2016 | $7,500 | $542,625 | $162,751 | $379,874 |
| 2015 | $7,395 | $534,475 | $160,307 | $374,168 |
| 2014 | $6,790 | $524,006 | $157,167 | $366,839 |
Source: Public Records
Map
Nearby Homes
- 4029 Sadie Ct
- 734 Pecan Way
- 1177 Smith Ave
- 1500 W San Tomas Aquino Rd
- 963 Connie Dr
- 295 Beverly Ct
- 2245 S San Tomas Aquino Rd
- 2329 Dorval Dr
- 786 Sharmon Palms Ln
- 1430 Westmont Ave
- 908 Marilyn Dr
- 803 W Sunnyoaks Ave
- 738 Sobrato Dr
- 4685 Lage Dr
- 1054 Steinway Ave
- 4754 Bannock Cir
- 123 Dot Ave
- 1285 Capri Dr
- 422 W Sunnyoaks Ave
- 1001 Audrey Ave
- 2339 Middletown Dr
- 3921 Middletown Ct
- 2333 Middletown Dr
- 3908 Middletown Ct
- 3929 Middletown Ct
- 3900 Middletown Ct
- 2348 Middletown Dr
- 3932 Middletown Ct
- 3916 Middletown Ct
- 2340 Middletown Dr
- 2330 Valerie Ct
- 3866 Century Dr
- 2327 Middletown Dr
- 2338 Valerie Ct
- 3924 Middletown Ct
- 3838 Century Dr
- 2498 Twyla Ct
- 2328 Middletown Dr
- 2319 Middletown Dr
- 2499 Twyla Ct
Your Personal Tour Guide
Ask me questions while you tour the home.