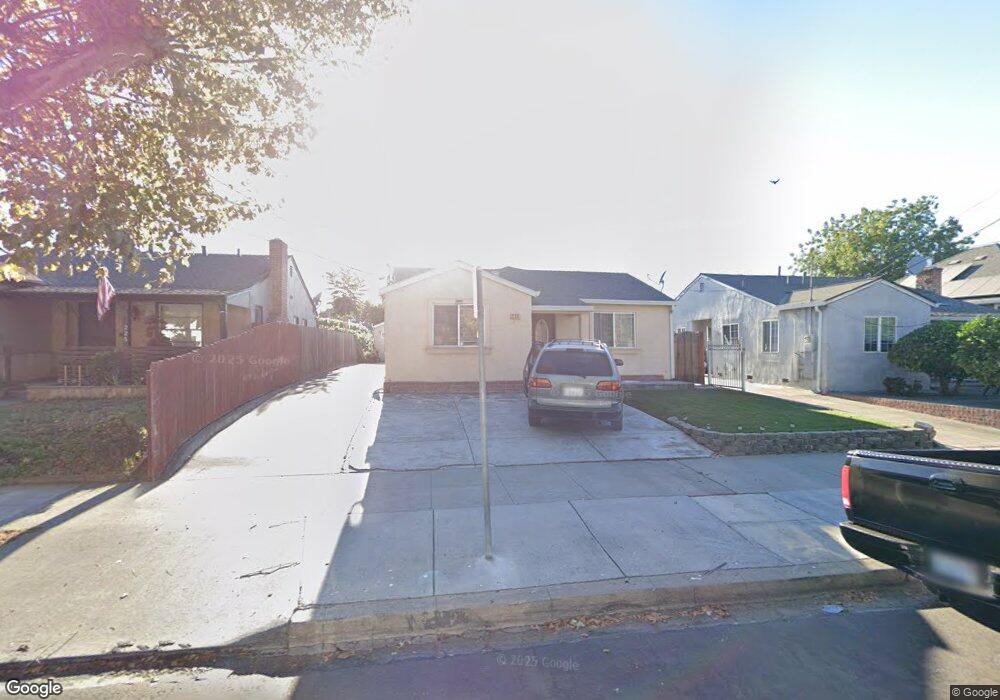
235 N 11th St San Jose, CA 95112
Northside NeighborhoodEstimated Value: $979,000 - $1,158,267
4
Beds
2
Baths
848
Sq Ft
$1,284/Sq Ft
Est. Value
About This Home
This home is located at 235 N 11th St, San Jose, CA 95112 and is currently estimated at $1,088,567, approximately $1,283 per square foot. 235 N 11th St is a home located in Santa Clara County with nearby schools including Horace Mann Elementary School, Muwekma Ohlone Middle, and San Jose High School.
Ownership History
Date
Name
Owned For
Owner Type
Purchase Details
Closed on
Jun 16, 1994
Sold by
Cabral Pat A
Bought by
Hernandez Hernan A and Hernandez Anna M
Current Estimated Value
Home Financials for this Owner
Home Financials are based on the most recent Mortgage that was taken out on this home.
Original Mortgage
$149,200
Interest Rate
8.6%
Create a Home Valuation Report for This Property
The Home Valuation Report is an in-depth analysis detailing your home's value as well as a comparison with similar homes in the area
Home Values in the Area
Average Home Value in this Area
Purchase History
| Date | Buyer | Sale Price | Title Company |
|---|---|---|---|
| Hernandez Hernan A | $186,500 | Stewart Title |
Source: Public Records
Mortgage History
| Date | Status | Borrower | Loan Amount |
|---|---|---|---|
| Closed | Hernandez Hernan A | $149,200 |
Source: Public Records
Tax History
| Year | Tax Paid | Tax Assessment Tax Assessment Total Assessment is a certain percentage of the fair market value that is determined by local assessors to be the total taxable value of land and additions on the property. | Land | Improvement |
|---|---|---|---|---|
| 2025 | $7,578 | $475,489 | $169,955 | $305,534 |
| 2024 | $7,578 | $466,167 | $166,623 | $299,544 |
| 2023 | $7,398 | $457,027 | $163,356 | $293,671 |
| 2022 | $7,317 | $448,066 | $160,153 | $287,913 |
| 2021 | $7,103 | $439,281 | $157,013 | $282,268 |
| 2020 | $6,848 | $434,778 | $155,404 | $279,374 |
| 2019 | $6,660 | $426,254 | $152,357 | $273,897 |
| 2018 | $6,565 | $417,897 | $149,370 | $268,527 |
| 2017 | $6,495 | $409,704 | $146,442 | $263,262 |
| 2016 | $6,324 | $401,671 | $143,571 | $258,100 |
| 2015 | $6,344 | $395,639 | $141,415 | $254,224 |
| 2014 | $5,458 | $387,890 | $138,645 | $249,245 |
Source: Public Records
Map
Nearby Homes
- 417 E Saint James St
- 196 N 9th St
- 271 N 9th St
- 361 N 10th St
- 431 E Saint John St
- 623 & 625 S 2nd St
- 333 & 335 N 4th St
- 403 N 12th St
- 684 E Julian St
- 401 N 13th St
- 362 N 7th St
- 915 E Julian St
- 325 E Saint John St
- 334 N 15th St
- 436 N 7th St
- 309 N 5th St
- 565 N 12th St
- 97 E Saint James St Unit 57
- 97 E Saint James St Unit 21
- 97 E Saint James St Unit 26
Your Personal Tour Guide
Ask me questions while you tour the home.