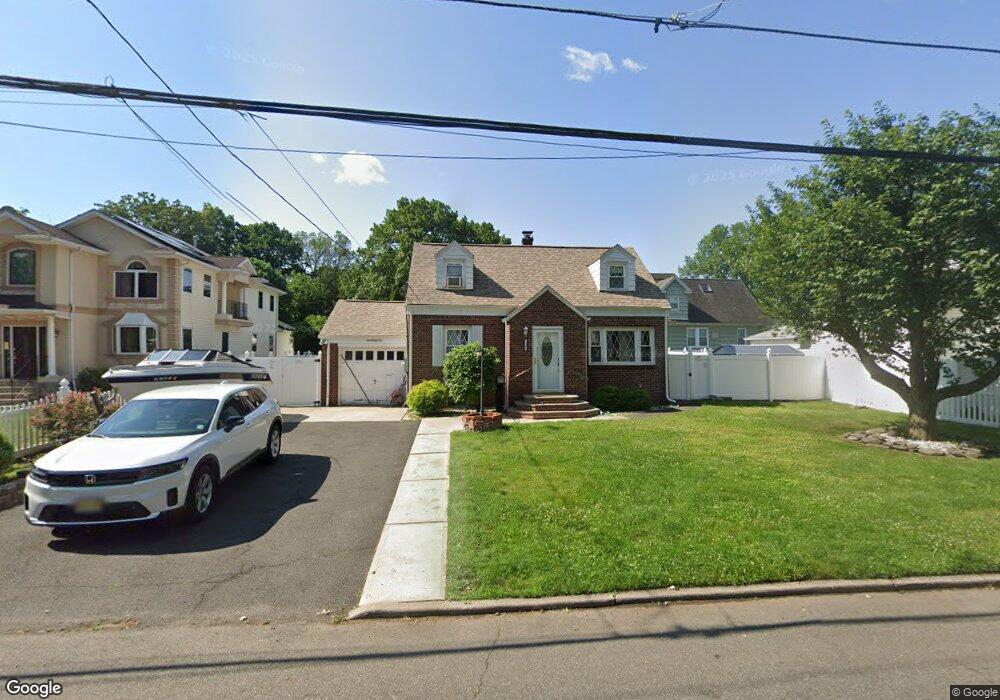
236 E Johnson Ave Bergenfield, NJ 07621
Estimated Value: $500,000 - $548,000
3
Beds
2
Baths
1,159
Sq Ft
$462/Sq Ft
Est. Value
About This Home
This home is located at 236 E Johnson Ave, Bergenfield, NJ 07621 and is currently estimated at $535,203, approximately $461 per square foot. 236 E Johnson Ave is a home located in Bergen County with nearby schools including Bergenfield High School and Lubavitch On The Palisades.
Ownership History
Date
Name
Owned For
Owner Type
Purchase Details
Closed on
Oct 31, 2019
Sold by
Centeno Humberto and Simancas Luz E
Bought by
Parra Luz and Parra Elver
Current Estimated Value
Home Financials for this Owner
Home Financials are based on the most recent Mortgage that was taken out on this home.
Original Mortgage
$250,000
Interest Rate
3.6%
Mortgage Type
New Conventional
Purchase Details
Closed on
Feb 29, 2016
Sold by
Nyborg Carmen
Bought by
Centeno Humberto and Simancas Luz Elena
Home Financials for this Owner
Home Financials are based on the most recent Mortgage that was taken out on this home.
Original Mortgage
$228,123
Interest Rate
3.72%
Mortgage Type
FHA
Purchase Details
Closed on
Jan 19, 2006
Purchase Details
Closed on
Jul 29, 1994
Sold by
Dragan Ann
Bought by
Nyborg Walter and Nyborg Carment
Home Financials for this Owner
Home Financials are based on the most recent Mortgage that was taken out on this home.
Original Mortgage
$105,000
Interest Rate
8.4%
Create a Home Valuation Report for This Property
The Home Valuation Report is an in-depth analysis detailing your home's value as well as a comparison with similar homes in the area
Home Values in the Area
Average Home Value in this Area
Purchase History
| Date | Buyer | Sale Price | Title Company |
|---|---|---|---|
| Parra Luz | -- | None Available | |
| Centeno Humberto | $236,000 | Attorney | |
| -- | -- | -- | |
| Nyborg Walter | $155,000 | -- |
Source: Public Records
Mortgage History
| Date | Status | Borrower | Loan Amount |
|---|---|---|---|
| Previous Owner | Parra Luz | $250,000 | |
| Previous Owner | Centeno Humberto | $228,123 | |
| Previous Owner | Nyborg Walter | $105,000 |
Source: Public Records
Tax History
| Year | Tax Paid | Tax Assessment Tax Assessment Total Assessment is a certain percentage of the fair market value that is determined by local assessors to be the total taxable value of land and additions on the property. | Land | Improvement |
|---|---|---|---|---|
| 2025 | $9,752 | $276,500 | $176,000 | $100,500 |
| 2024 | $9,429 | $276,500 | $176,000 | $100,500 |
| 2023 | $9,282 | $276,500 | $176,000 | $100,500 |
| 2022 | $9,282 | $276,500 | $176,000 | $100,500 |
| 2021 | $9,185 | $276,500 | $176,000 | $100,500 |
| 2020 | $9,125 | $276,500 | $176,000 | $100,500 |
| 2019 | $9,019 | $276,500 | $176,000 | $100,500 |
| 2018 | $8,953 | $276,500 | $176,000 | $100,500 |
| 2017 | $8,909 | $276,500 | $176,000 | $100,500 |
| 2016 | $8,768 | $276,500 | $176,000 | $100,500 |
| 2015 | $8,632 | $276,500 | $176,000 | $100,500 |
| 2014 | $8,475 | $276,500 | $176,000 | $100,500 |
Source: Public Records
Map
Nearby Homes
- 168 4th St
- 181 Phelps Ave
- 241 E Main St Unit 1D
- 133 E Church St
- 110 New York Ave
- 14 Hudson St
- 50 S 1st St Unit 3A
- 109 Bradley Ave
- 15 Dunn Place
- 125 E Main St
- 40 Depew St
- 9 New York Ave
- 74 Shadyside Ave
- 17 Wight Place
- 248 E Clinton Ave
- 364 W Clinton Ave
- 136 Stonegate Trail Unit 37
- 119 Stonegate Trail
- 83 N Washington Ave
- 175 Hillside Ave
- 228 E Johnson Ave
- 91 Bogert Place
- 240 E Johnson Ave
- 240 E Johnson Ave Unit 1
- 93 Bogert Place
- 233 E Johnson Ave
- 235 E Johnson Ave
- 229 E Johnson Ave
- 95 Bogert Place
- 244 E Johnson Ave
- 237 E Johnson Ave
- 220 E Johnson Ave
- 80 Bogert Place
- 82 Bogert Place
- 250 E Johnson Ave
- 114 Bogert Place
- 241 E Johnson Ave
- 81 Bogert Place
- 238 Hickory Ave
- 92 Bogert Place
Your Personal Tour Guide
Ask me questions while you tour the home.