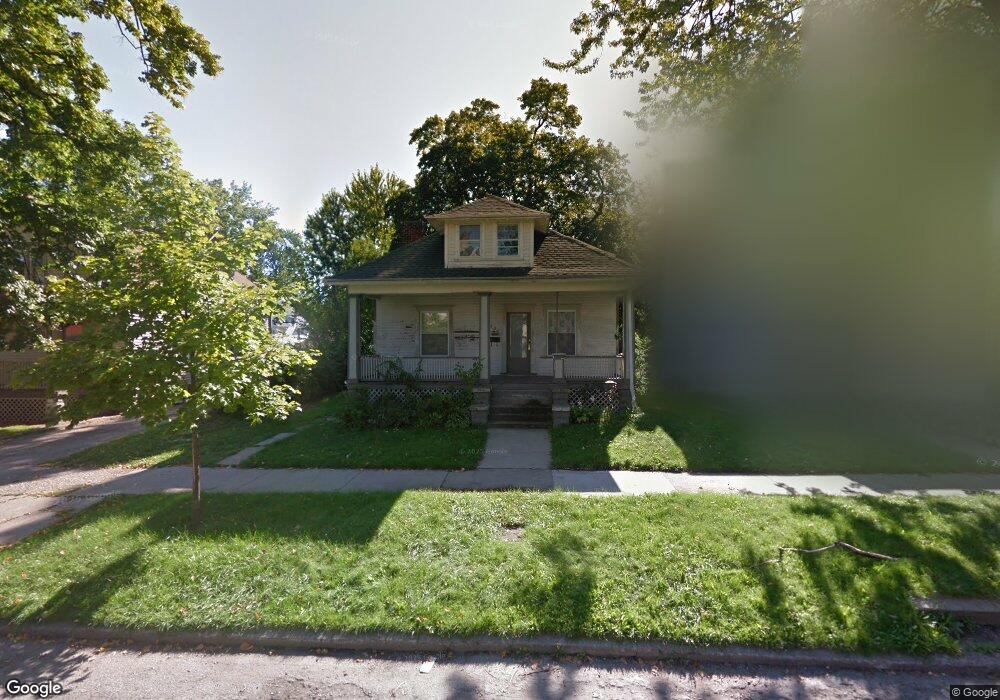
236 N Jackson St Bay City, MI 48708
Estimated Value: $105,000 - $139,352
3
Beds
2
Baths
1,450
Sq Ft
$85/Sq Ft
Est. Value
About This Home
This home is located at 236 N Jackson St, Bay City, MI 48708 and is currently estimated at $122,588, approximately $84 per square foot. 236 N Jackson St is a home located in Bay County with nearby schools including Jumpertown High School, Wheeler High School, and Washington Elementary School.
Ownership History
Date
Name
Owned For
Owner Type
Purchase Details
Closed on
Sep 3, 2015
Sold by
Taste Of Life Ministries
Bought by
Zeneberg Craig and Zeneberg Marsha
Current Estimated Value
Purchase Details
Closed on
Feb 28, 2012
Sold by
Arts District Llc
Bought by
Farragut Schoolhouse Llc
Purchase Details
Closed on
Feb 21, 2012
Sold by
Farragut Schoolhouse Llc
Bought by
Taste Of Life Ministries
Purchase Details
Closed on
Apr 26, 2011
Sold by
Ingersoll Steven J and Ingersoll Deborah M
Bought by
Arts District Llc
Purchase Details
Closed on
Dec 15, 2010
Sold by
Mackenzie Nancy
Bought by
Ingersoll Steve
Purchase Details
Closed on
Nov 23, 2009
Sold by
Mackenzie Jack R
Bought by
Ingersoll Steven
Purchase Details
Closed on
Jul 15, 2005
Sold by
Talkington Jeffery C and Markel Nettie G
Bought by
Mackenzie Jack and Mackenzie Nancy
Purchase Details
Closed on
Oct 15, 1999
Sold by
Markel Nettie G and Talkington Marth
Bought by
Markel Nettie G and Talkington Mart
Create a Home Valuation Report for This Property
The Home Valuation Report is an in-depth analysis detailing your home's value as well as a comparison with similar homes in the area
Home Values in the Area
Average Home Value in this Area
Purchase History
| Date | Buyer | Sale Price | Title Company |
|---|---|---|---|
| Zeneberg Craig | $5,000 | None Available | |
| Farragut Schoolhouse Llc | -- | None Available | |
| Taste Of Life Ministries | $10,000 | None Available | |
| Arts District Llc | -- | None Available | |
| Ingersoll Steve | -- | None Available | |
| Ingersoll Steven | $7,000 | None Available | |
| Mackenzie Jack | $26,900 | Fatic | |
| Markel Nettie G | -- | -- |
Source: Public Records
Tax History Compared to Growth
Tax History
| Year | Tax Paid | Tax Assessment Tax Assessment Total Assessment is a certain percentage of the fair market value that is determined by local assessors to be the total taxable value of land and additions on the property. | Land | Improvement |
|---|---|---|---|---|
| 2025 | $2,565 | $59,100 | $0 | $0 |
| 2024 | $2,237 | $53,500 | $0 | $0 |
| 2023 | $2,130 | $45,750 | $0 | $0 |
| 2022 | $2,313 | $40,950 | $0 | $0 |
| 2021 | $2,193 | $39,550 | $39,550 | $0 |
| 2020 | $2,284 | $34,450 | $34,450 | $0 |
| 2019 | $2,242 | $33,650 | $0 | $0 |
| 2018 | $2,214 | $32,900 | $0 | $0 |
| 2017 | $2,175 | $32,350 | $0 | $0 |
| 2016 | $2,508 | $37,200 | $0 | $37,200 |
| 2015 | $145 | $0 | $0 | $0 |
| 2014 | $145 | $0 | $0 | $0 |
Source: Public Records
Map
Nearby Homes
- 301 N Van Buren St
- 224 N Madison Ave
- 800 Mckinley St
- 509 11th St
- 302 N Farragut St
- 1010 13th St
- 904 6th St
- 000 County Road 246 West Ave
- 1010 6th Street 6th St
- 208 S Sheridan St
- 701 Center Ave
- 321 N Birney St
- 909 Center Ave
- 701 15th St
- 1517 11th St
- 316 Fraser St
- 1713 9th St
- 1216 4th St
- 1708 6th St
- 709 S Van Buren St
- 244 N Jackson St
- 246 N Jackson St
- 237 N Van Buren St
- 224 N Jackson St
- 241 N Van Buren St
- 233 N Van Buren St
- 227 N Van Buren St
- 245 N Van Buren St
- 235 N Jackson St
- 231 N Jackson St
- 241 N Jackson St
- 222 N Jackson St
- 225 N Van Buren St
- 227 N Jackson St
- 245 N Jackson St
- 247 N Van Buren St
- 220 N Jackson St
- 225 N Jackson St
- 223 N Van Buren St
- 250 N Jackson St