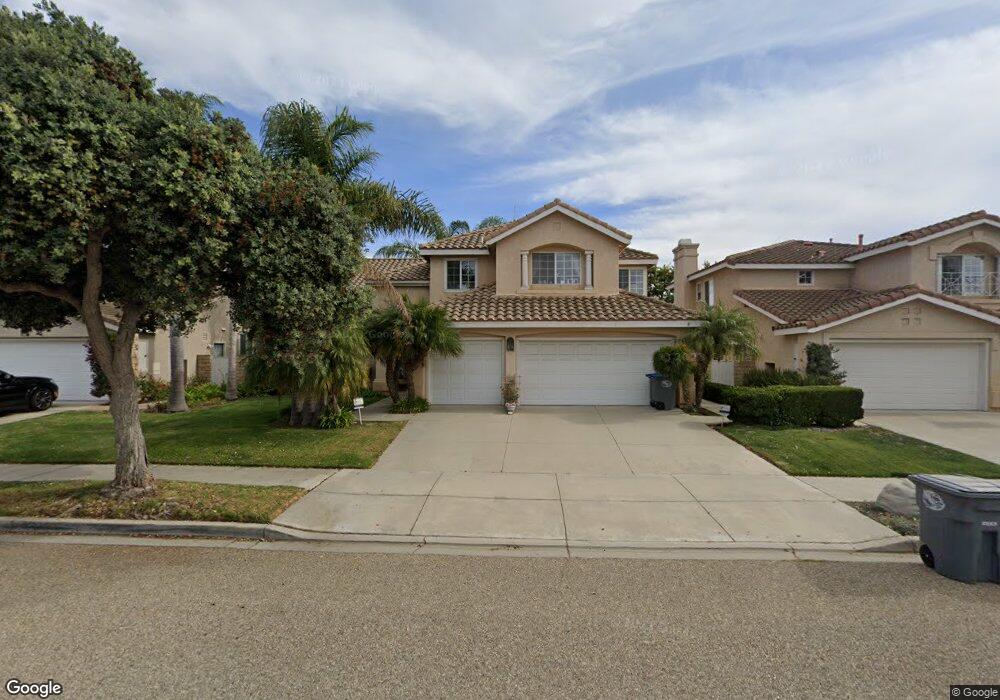
2360 Diamond Head Way Oxnard, CA 93036
Windsor North River Ridge NeighborhoodEstimated Value: $1,121,000 - $1,231,000
4
Beds
3
Baths
2,198
Sq Ft
$526/Sq Ft
Est. Value
About This Home
This home is located at 2360 Diamond Head Way, Oxnard, CA 93036 and is currently estimated at $1,156,278, approximately $526 per square foot. 2360 Diamond Head Way is a home located in Ventura County with nearby schools including Thurgood Marshall Elementary School and Oxnard High School.
Ownership History
Date
Name
Owned For
Owner Type
Purchase Details
Closed on
May 27, 2013
Sold by
Jackson Donald C and Jackson Sandra Jill
Bought by
Jackson Donald C
Current Estimated Value
Home Financials for this Owner
Home Financials are based on the most recent Mortgage that was taken out on this home.
Original Mortgage
$184,850
Interest Rate
3.32%
Mortgage Type
New Conventional
Purchase Details
Closed on
Feb 27, 2003
Sold by
Bennett Albert A and Bennett Patricia R
Bought by
Jackson Donald C and Jackson Sandra Jill
Home Financials for this Owner
Home Financials are based on the most recent Mortgage that was taken out on this home.
Original Mortgage
$150,000
Interest Rate
5.77%
Mortgage Type
Purchase Money Mortgage
Purchase Details
Closed on
May 23, 1995
Sold by
Trimark Development Company
Bought by
Bennett Albert A and Bennett Patricia R
Home Financials for this Owner
Home Financials are based on the most recent Mortgage that was taken out on this home.
Original Mortgage
$195,900
Interest Rate
7.92%
Create a Home Valuation Report for This Property
The Home Valuation Report is an in-depth analysis detailing your home's value as well as a comparison with similar homes in the area
Home Values in the Area
Average Home Value in this Area
Purchase History
We collect this data history from publicly available records. To have your information removed, we recommend requesting removal directly through your county’s website.
| Date | Buyer | Sale Price | Title Company |
|---|---|---|---|
| Jackson Donald C | -- | Lansafe Title Of Ca Inc | |
| Jackson Donald C | $510,000 | Chicago Title | |
| Bennett Albert A | $244,954 | Continental Lawyers Title |
Source: Public Records
Mortgage History
We collect this data history from publicly available records. To have your information removed, we recommend requesting removal directly through your county’s website.
| Date | Status | Borrower | Loan Amount |
|---|---|---|---|
| Closed | Jackson Donald C | $184,850 | |
| Previous Owner | Jackson Donald C | $150,000 | |
| Previous Owner | Bennett Albert A | $195,900 | |
| Closed | Jackson Donald C | $115,000 |
Source: Public Records
Tax History
| Year | Tax Paid | Tax Assessment Tax Assessment Total Assessment is a certain percentage of the fair market value that is determined by local assessors to be the total taxable value of land and additions on the property. | Land | Improvement |
|---|---|---|---|---|
| 2025 | $8,867 | $738,633 | $369,318 | $369,315 |
| 2024 | $8,867 | $724,150 | $362,076 | $362,074 |
| 2023 | $8,542 | $709,951 | $354,976 | $354,975 |
| 2022 | $8,283 | $696,031 | $348,016 | $348,015 |
| 2021 | $8,215 | $682,384 | $341,192 | $341,192 |
| 2020 | $8,367 | $675,390 | $337,695 | $337,695 |
| 2019 | $8,129 | $662,148 | $331,074 | $331,074 |
| 2018 | $8,014 | $649,166 | $324,583 | $324,583 |
| 2017 | $7,603 | $636,438 | $318,219 | $318,219 |
| 2016 | $7,345 | $623,960 | $311,980 | $311,980 |
| 2015 | $7,344 | $609,000 | $304,000 | $305,000 |
| 2014 | $6,687 | $550,000 | $275,000 | $275,000 |
Source: Public Records
Map
Nearby Homes
- 2211 Pebble Beach Trail
- 2202 Desert Forest Ct
- 2113 Doral Ct
- 2177 Eastridge Trail
- 2134 Cold Stream Ct
- 1931 Augusta Ct
- 1625 Range Rd
- 3452 Brookwood Ln
- 1611 Kapalua Dr
- 1616 Range Rd
- 1600 Mulligan St
- 2151 Olga St
- 1510 Holly Ave
- 2060 Norma St
- 1340 Kumquat Place
- 1000 Fuchsia St
- 2500 Lilac Walk
- 1731 Oneida Place
- 1430 Huntswood Way
- 643 Holly Ave
- 2370 Diamond Head Way
- 2350 Diamond Head Way
- 2331 Crystal Downs Ct
- 2340 Diamond Head Way
- 2321 Crystal Downs Ct
- 2380 Diamond Head Way
- 2341 Crystal Downs Ct
- 2351 Crystal Downs Ct
- 2311 Crystal Downs Ct
- 2371 Diamond Head Way
- 2351 Diamond Head Way
- 2330 Diamond Head Way
- 2381 Diamond Head Way
- 2341 Diamond Head Way
- 2320 Diamond Head Away
- 2320 Diamond Head Way
- 2331 Diamond Head Way
- 2301 Crystal Downs Ct
- 2346 Eagle Creek Ln
- 2348 Eagle Creek Ln
Your Personal Tour Guide
Ask me questions while you tour the home.