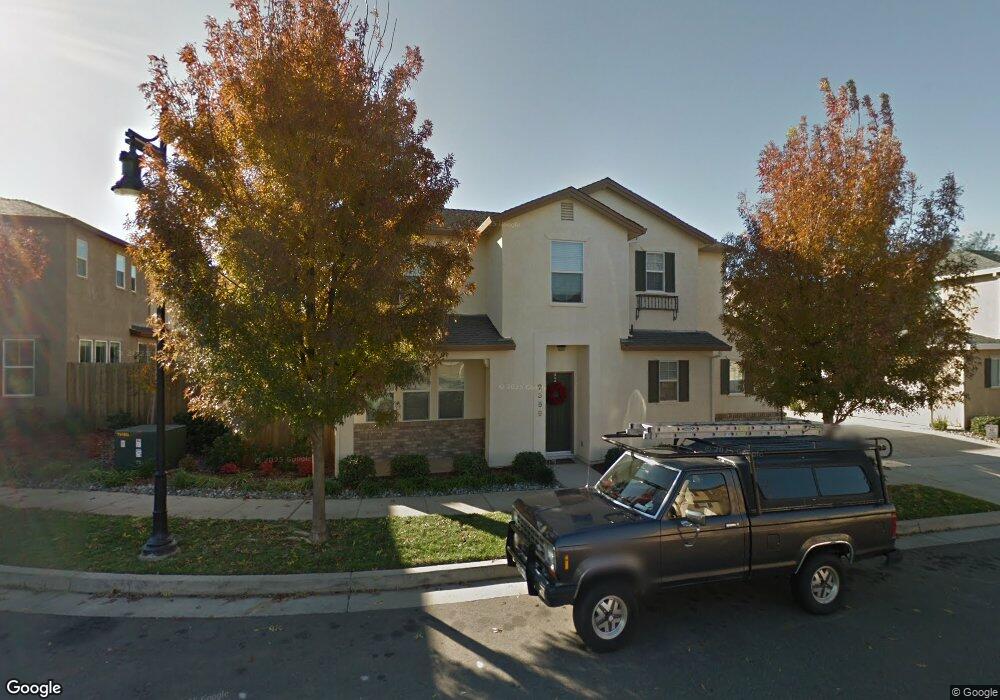
2363 Shining Star Way Redding, CA 96003
North Shasta View NeighborhoodEstimated Value: $296,000 - $366,000
3
Beds
3
Baths
1,378
Sq Ft
$237/Sq Ft
Est. Value
About This Home
This home is located at 2363 Shining Star Way, Redding, CA 96003 and is currently estimated at $326,171, approximately $236 per square foot. 2363 Shining Star Way is a home located in Shasta County with nearby schools including Shasta Meadows Elementary School, Parsons Junior High School, and Enterprise High School.
Ownership History
Date
Name
Owned For
Owner Type
Purchase Details
Closed on
Nov 5, 2010
Sold by
Gmac Mortgage Llc
Bought by
Dickson Danell D
Current Estimated Value
Home Financials for this Owner
Home Financials are based on the most recent Mortgage that was taken out on this home.
Original Mortgage
$101,000
Outstanding Balance
$66,332
Interest Rate
4.18%
Mortgage Type
New Conventional
Estimated Equity
$259,839
Purchase Details
Closed on
Aug 20, 2010
Sold by
Zolotoff Alan
Bought by
Gmac Mortgage Llc
Purchase Details
Closed on
Aug 18, 2006
Sold by
Palomar Builders Inc
Bought by
Zolotoff Alan
Home Financials for this Owner
Home Financials are based on the most recent Mortgage that was taken out on this home.
Original Mortgage
$14,300
Interest Rate
6.7%
Mortgage Type
Stand Alone Second
Purchase Details
Closed on
Jan 19, 2006
Sold by
Village Development Co
Bought by
Palomar Builders Inc
Create a Home Valuation Report for This Property
The Home Valuation Report is an in-depth analysis detailing your home's value as well as a comparison with similar homes in the area
Home Values in the Area
Average Home Value in this Area
Purchase History
| Date | Buyer | Sale Price | Title Company |
|---|---|---|---|
| Dickson Danell D | $142,000 | Fidelity National Title Co | |
| Gmac Mortgage Llc | $138,550 | Accommodation | |
| Zolotoff Alan | $286,000 | Placer Title Company | |
| Palomar Builders Inc | $752,000 | Placer Title Company |
Source: Public Records
Mortgage History
| Date | Status | Borrower | Loan Amount |
|---|---|---|---|
| Open | Dickson Danell D | $101,000 | |
| Previous Owner | Zolotoff Alan | $14,300 | |
| Previous Owner | Zolotoff Alan | $228,700 |
Source: Public Records
Tax History
| Year | Tax Paid | Tax Assessment Tax Assessment Total Assessment is a certain percentage of the fair market value that is determined by local assessors to be the total taxable value of land and additions on the property. | Land | Improvement |
|---|---|---|---|---|
| 2025 | $2,054 | $181,912 | $44,833 | $137,079 |
| 2024 | $2,024 | $178,346 | $43,954 | $134,392 |
| 2023 | $2,024 | $174,850 | $43,093 | $131,757 |
| 2022 | $1,966 | $171,423 | $42,249 | $129,174 |
| 2021 | $1,895 | $168,063 | $41,421 | $126,642 |
| 2020 | $1,871 | $166,341 | $40,997 | $125,344 |
| 2019 | $1,864 | $163,081 | $40,194 | $122,887 |
| 2018 | $1,842 | $159,884 | $39,406 | $120,478 |
| 2017 | $1,852 | $156,750 | $38,634 | $118,116 |
| 2016 | $1,767 | $153,677 | $37,877 | $115,800 |
| 2015 | $1,731 | $151,370 | $37,309 | $114,061 |
| 2014 | $1,711 | $148,406 | $36,579 | $111,827 |
Source: Public Records
Map
Nearby Homes
- 1945 Salzburg Trail
- 1865 Dellwood Dr
- 2571 Erin Ln
- 2093 Victor Ave
- 2728 Jasmine Way
- 2455 Belladonna St
- 2867 Camulos Way
- 1595 Sterling Dr
- 1637 French Lace Ln
- 1701 E Cypress Ave
- 2100 Deerfield Ave
- 2912 Squire Ave
- 10033 Abernathy Ln
- 2681 Hartnell Ave
- 3051 Leonard St
- 2935 Snow Fire Ct
- 1953 Cameo Ct
- 3072 Alta Mesa Dr
- 3307 Tarmac Rd
- 1461 Oakdale Ln
- 2359 Shining Star Way
- 2367 Shining Star Way
- 2371 Shining Star Way Unit Lot 93
- 2371 Shining Star Way
- 2347 Shining Star Way Unit Lot 89
- 2347 Shining Star Way
- 2379 Shining Star Way Unit Lot 97
- 2379 Shining Star Way
- 2375 Shining Star Way Unit Lot 96
- 2375 Shining Star Way
- 2343 Shining Star Way
- 2355 Shining Star Way Unit Lot 91
- 2355 Shining Star Way
- 2381 Shining Star Way Unit Lot 98
- 2381 Shining Star Way
- 2351 Shining Star Way Unit Lot 90
- 2351 Shining Star Way
- 2385 Shining Star Way Unit Lot 99
- 2341 Shining Star Way
- 2384 Shining Star Way Unit Lot 55
Your Personal Tour Guide
Ask me questions while you tour the home.