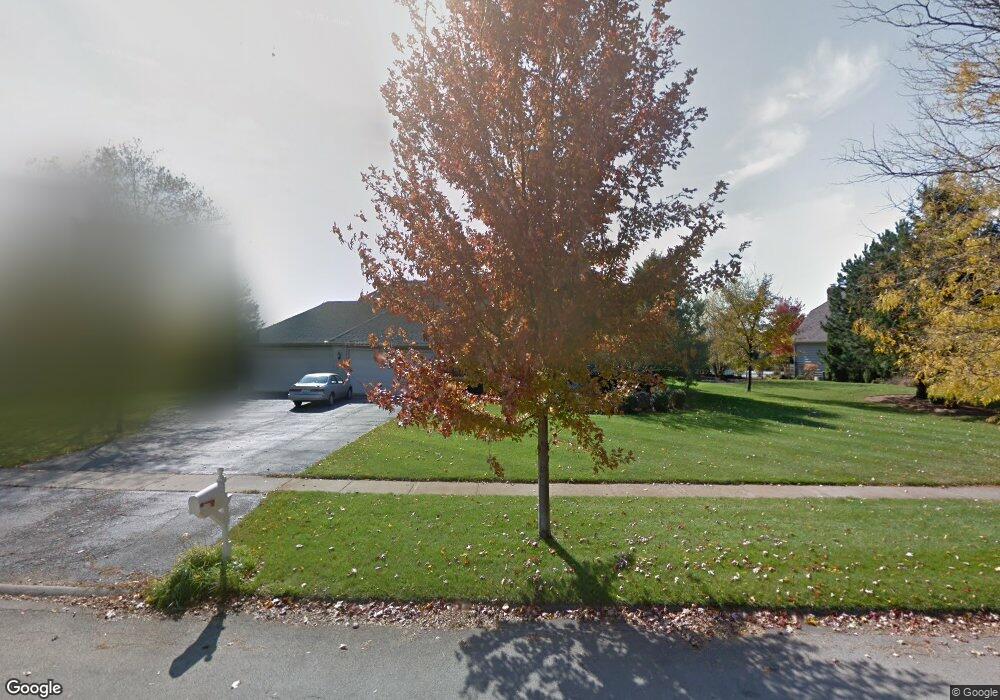
23645 Deer Chase Ln Naperville, IL 60564
Crestview Knoll NeighborhoodEstimated Value: $723,258 - $788,000
--
Bed
--
Bath
2,884
Sq Ft
$262/Sq Ft
Est. Value
About This Home
This home is located at 23645 Deer Chase Ln, Naperville, IL 60564 and is currently estimated at $754,815, approximately $261 per square foot. 23645 Deer Chase Ln is a home located in Will County with nearby schools including Oliver Julian Kendall Elementary School, Ellsworth Elementary School, and Clifford Crone Middle School.
Ownership History
Date
Name
Owned For
Owner Type
Purchase Details
Closed on
Aug 24, 2001
Sold by
Kasper Thomas E and Kasper Linda M
Bought by
Kasper Thomas E and Kasper Linda M
Current Estimated Value
Home Financials for this Owner
Home Financials are based on the most recent Mortgage that was taken out on this home.
Original Mortgage
$100,000
Interest Rate
7.28%
Purchase Details
Closed on
Jul 31, 2001
Sold by
Murphy Michael J and Murphy Deena L
Bought by
Kasper Thomas E and Kasper Linda M
Home Financials for this Owner
Home Financials are based on the most recent Mortgage that was taken out on this home.
Original Mortgage
$100,000
Interest Rate
7.28%
Purchase Details
Closed on
Sep 14, 1995
Sold by
Firstar Bank Illinois
Bought by
Murphy Michael J and Murphy Deena L
Home Financials for this Owner
Home Financials are based on the most recent Mortgage that was taken out on this home.
Original Mortgage
$190,000
Interest Rate
8%
Create a Home Valuation Report for This Property
The Home Valuation Report is an in-depth analysis detailing your home's value as well as a comparison with similar homes in the area
Home Values in the Area
Average Home Value in this Area
Purchase History
| Date | Buyer | Sale Price | Title Company |
|---|---|---|---|
| Kasper Thomas E | -- | -- | |
| Kasper Thomas E | $445,000 | -- | |
| Murphy Michael J | $284,000 | Chicago Title Insurance Co |
Source: Public Records
Mortgage History
| Date | Status | Borrower | Loan Amount |
|---|---|---|---|
| Closed | Kasper Thomas E | $100,000 | |
| Previous Owner | Murphy Michael J | $190,000 |
Source: Public Records
Tax History Compared to Growth
Tax History
| Year | Tax Paid | Tax Assessment Tax Assessment Total Assessment is a certain percentage of the fair market value that is determined by local assessors to be the total taxable value of land and additions on the property. | Land | Improvement |
|---|---|---|---|---|
| 2024 | $12,576 | $201,012 | $44,185 | $156,827 |
| 2023 | $12,576 | $177,573 | $39,033 | $138,540 |
| 2022 | $11,670 | $167,982 | $36,924 | $131,058 |
| 2021 | $11,127 | $159,983 | $35,166 | $124,817 |
| 2020 | $10,920 | $157,448 | $34,609 | $122,839 |
| 2019 | $10,729 | $153,011 | $33,634 | $119,377 |
| 2018 | $11,226 | $156,682 | $32,894 | $123,788 |
| 2017 | $11,077 | $152,637 | $32,045 | $120,592 |
| 2016 | $11,030 | $149,351 | $31,355 | $117,996 |
| 2015 | $11,124 | $143,607 | $30,149 | $113,458 |
| 2014 | $11,124 | $141,072 | $30,149 | $110,923 |
| 2013 | $11,124 | $141,072 | $30,149 | $110,923 |
Source: Public Records
Map
Nearby Homes
- 2255 Wendt Cir
- 29W316 Andermann Dr
- 2711 Wait Rd
- 1736 Robert Ln
- 1804 Princess Cir
- 3707 Junebreeze Ln
- 3616 Eliot Ln
- 3432 Redwing Dr Unit 2
- 11110 Highland Dr
- 24531 W 103rd St
- 3281 Cool Springs Ct
- 26106 W Sherwood Cir
- 23234 W Allagash Dr
- 3420 Sunnyside Ct
- 3423 Sunnyside Ct
- 24024 W Champion Dr
- 11319 Maplewood Dr
- 3421 Goldfinch Dr
- 3740 Ryder Ct
- 3816 Rosada Dr
- 23633 Deer Chase Ln
- 23665 W Deer Chase Ln
- 23715 Deer Chase Ln
- 23629 W Deer Chase Ln
- 10524 Red Stable Way
- 10601 Quail Ridge Ct
- 10605 S Quail Ridge Ct
- 23625 Deer Chase Ln
- 23644 Deer Chase Ln
- 23632 W Deer Chase Ln
- 23737 Deer Chase Ln
- 7650 Quail Ridge Ct
- 7918 Quail Ridge Ct
- 23636 Deer Chase Ln
- 10506 Red Stable Way
- 10613 Quail Ridge Ct
- 23716 W Deer Chase Ln
- 23716 Deer Chase Ln
- 10529 Red Stable Way
- 23632 Deer Chase Ln