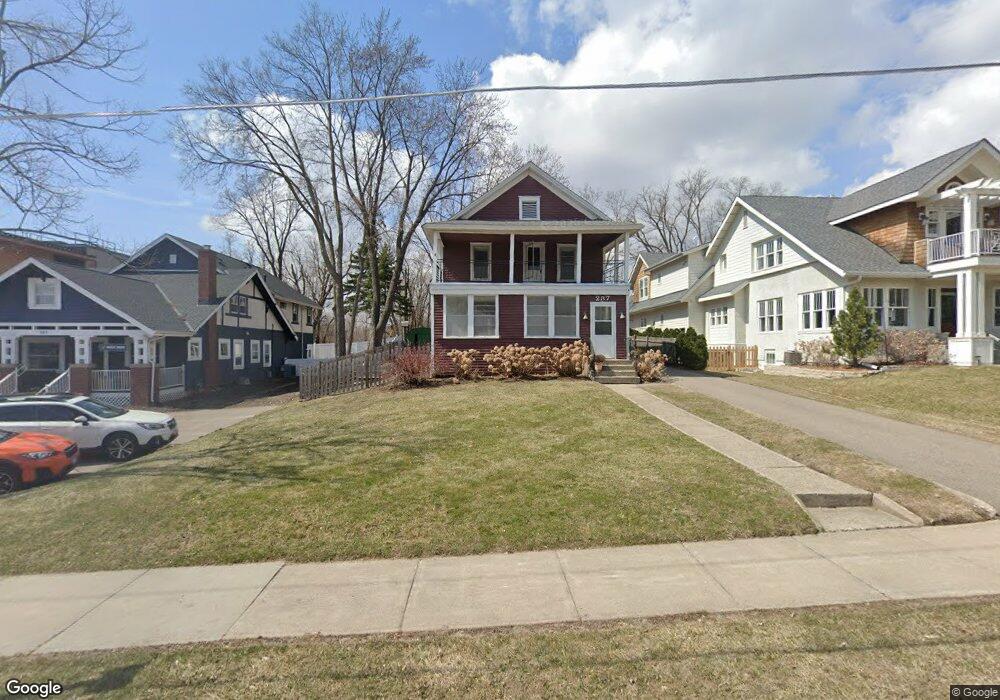
237 Manitoba Ave Wayzata, MN 55391
Estimated Value: $874,000 - $1,034,000
4
Beds
2
Baths
1,584
Sq Ft
$595/Sq Ft
Est. Value
About This Home
This home is located at 237 Manitoba Ave, Wayzata, MN 55391 and is currently estimated at $942,030, approximately $594 per square foot. 237 Manitoba Ave is a home located in Hennepin County with nearby schools including Gleason Lake Elementary School, Wayzata West Middle School, and Wayzata High School.
Ownership History
Date
Name
Owned For
Owner Type
Purchase Details
Closed on
Apr 30, 2025
Sold by
Renovo Holdings Llc
Bought by
Lavelle Benjamin
Current Estimated Value
Purchase Details
Closed on
Dec 31, 2022
Sold by
Frey Michael J and Frey Karen B
Bought by
Renovo Holdings Llc
Purchase Details
Closed on
Jun 15, 2021
Sold by
Frey Sara Ann and Frey David J
Bought by
Frey Michael J and Frey Karen B
Purchase Details
Closed on
Jul 10, 2017
Sold by
Frey Davdi and Frey Sara Ann
Bought by
Frey Sara Ann and Frey David Joseph
Purchase Details
Closed on
Jan 31, 2014
Sold by
Slp Enterprises Llc
Bought by
Frey David
Purchase Details
Closed on
Nov 29, 2011
Sold by
Meehan Jeffrey C and Meehan Joan Z
Bought by
Slp Enterprises Llc
Purchase Details
Closed on
Jul 26, 2000
Sold by
Estate Of Len L Stemmer Jr
Bought by
Meehan Jeffrey C and Meehan Joan Z
Create a Home Valuation Report for This Property
The Home Valuation Report is an in-depth analysis detailing your home's value as well as a comparison with similar homes in the area
Home Values in the Area
Average Home Value in this Area
Purchase History
| Date | Buyer | Sale Price | Title Company |
|---|---|---|---|
| Lavelle Benjamin | $870,237 | -- | |
| Renovo Holdings Llc | $700,000 | -- | |
| Frey Michael J | $700,000 | None Available | |
| Frey Sara Ann | -- | None Available | |
| Frey David | $470,000 | None Available | |
| Slp Enterprises Llc | -- | None Available | |
| Meehan Jeffrey C | $289,000 | -- | |
| Frey Michael Michael | $700,000 | -- |
Source: Public Records
Tax History Compared to Growth
Tax History
| Year | Tax Paid | Tax Assessment Tax Assessment Total Assessment is a certain percentage of the fair market value that is determined by local assessors to be the total taxable value of land and additions on the property. | Land | Improvement |
|---|---|---|---|---|
| 2024 | $10,002 | $866,600 | $710,000 | $156,600 |
| 2023 | $9,530 | $860,700 | $700,000 | $160,700 |
| 2022 | $7,270 | $642,000 | $490,000 | $152,000 |
| 2021 | $6,889 | $595,000 | $490,000 | $105,000 |
| 2020 | $6,149 | $569,000 | $467,000 | $102,000 |
| 2019 | $5,864 | $501,000 | $334,000 | $167,000 |
| 2018 | $5,777 | $476,000 | $304,000 | $172,000 |
| 2017 | $5,089 | $405,000 | $255,000 | $150,000 |
| 2016 | $4,992 | $384,000 | $232,000 | $152,000 |
| 2015 | $4,884 | $365,000 | $220,000 | $145,000 |
| 2014 | -- | $340,000 | $205,000 | $135,000 |
Source: Public Records
Map
Nearby Homes
- 221 Manitoba Ave
- 415 Indian Mound St Unit 203
- 123 Minnetonka Ave S
- 296 Grace Pointe Ct
- 205 Barry Ave S Unit 208
- 205 Barry Ave S Unit 210
- 205 Barry Ave S Unit 305
- 540 Rice St E
- 215 Barry Ave S Unit 104
- 270 Wayzata Blvd E
- 105 Walker Ave N
- 132 Minnetonka Ave N
- 222 Ferndale Rd S Unit 103
- 222 Ferndale Rd S Unit 203
- 150 Broadway Ave S Unit 2B
- 150 Broadway Ave S
- 150 Broadway Ave S Unit 2A
- 150 Broadway Ave S Unit 3D
- 724 Widsten Cir
- 641 Park St E
- 231 Manitoba Ave
- 307 Manitoba Ave
- 225 Manitoba Ave
- 315 Manitoba Ave
- 328 Barry Ave S
- 240 Manitoba Ave
- 230 Barry Ave S
- 236 Barry Ave S Unit 236
- 211 Manitoba Ave
- 230 Manitoba Ave Unit 220
- 230 Manitoba Ave Unit 210
- 230 Manitoba Ave Unit SOUTH
- 230 Manitoba Ave Unit NORTH
- 230 Manitoba Ave Unit 120
- 230 Manitoba Ave S #210 + 220
- 230 230 Manitoba Ave
- 230 230 Manitoba-Avenue-
- 220 Barry Ave S
- 415 415 Indian Mound St
- 415 Indian Mound St Unit 202