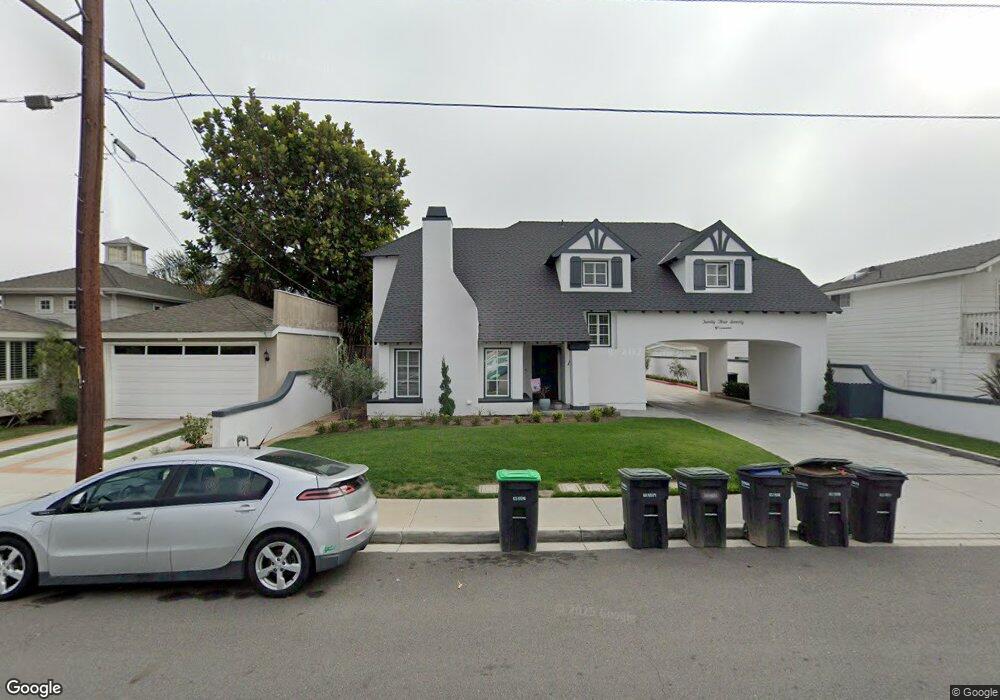
2370 Elden Ave Unit B Costa Mesa, CA 92627
Eastside Costa Mesa NeighborhoodEstimated Value: $1,095,000 - $1,154,000
2
Beds
2
Baths
1,646
Sq Ft
$683/Sq Ft
Est. Value
About This Home
This home is located at 2370 Elden Ave Unit B, Costa Mesa, CA 92627 and is currently estimated at $1,124,754, approximately $683 per square foot. 2370 Elden Ave Unit B is a home located in Orange County with nearby schools including Heinz Kaiser Elementary School, Woodland Elementary School, and Horace Ensign Intermediate School.
Ownership History
Date
Name
Owned For
Owner Type
Purchase Details
Closed on
Apr 27, 2020
Sold by
Mchone Meagan
Bought by
Wakefield James R
Current Estimated Value
Home Financials for this Owner
Home Financials are based on the most recent Mortgage that was taken out on this home.
Original Mortgage
$200,000
Outstanding Balance
$177,888
Interest Rate
3.5%
Mortgage Type
New Conventional
Estimated Equity
$946,866
Purchase Details
Closed on
Feb 21, 2020
Sold by
Gomez Christopher and Mchone Meagan
Bought by
Mchone Meagan
Purchase Details
Closed on
Feb 13, 2012
Sold by
Mchone David G and Mchone Donna
Bought by
Gomez Christopher and Gomez Meagan
Home Financials for this Owner
Home Financials are based on the most recent Mortgage that was taken out on this home.
Original Mortgage
$256,000
Interest Rate
3.83%
Mortgage Type
New Conventional
Create a Home Valuation Report for This Property
The Home Valuation Report is an in-depth analysis detailing your home's value as well as a comparison with similar homes in the area
Home Values in the Area
Average Home Value in this Area
Purchase History
| Date | Buyer | Sale Price | Title Company |
|---|---|---|---|
| Wakefield James R | $710,000 | Wfg National Title Co Of Ca | |
| Mchone Meagan | $100,000 | Wfg National Title | |
| Gomez Christopher | $357,500 | -- |
Source: Public Records
Mortgage History
| Date | Status | Borrower | Loan Amount |
|---|---|---|---|
| Open | Wakefield James R | $200,000 | |
| Previous Owner | Gomez Christopher | $256,000 |
Source: Public Records
Tax History
| Year | Tax Paid | Tax Assessment Tax Assessment Total Assessment is a certain percentage of the fair market value that is determined by local assessors to be the total taxable value of land and additions on the property. | Land | Improvement |
|---|---|---|---|---|
| 2025 | $8,771 | $776,487 | $616,919 | $159,568 |
| 2024 | $8,771 | $761,262 | $604,822 | $156,440 |
| 2023 | $8,532 | $746,336 | $592,963 | $153,373 |
| 2022 | $8,359 | $731,702 | $581,336 | $150,366 |
| 2021 | $8,256 | $717,355 | $569,937 | $147,418 |
| 2020 | $4,500 | $369,168 | $196,538 | $172,630 |
| 2019 | $4,403 | $361,930 | $192,684 | $169,246 |
| 2018 | $4,314 | $354,834 | $188,906 | $165,928 |
| 2017 | $4,243 | $347,877 | $185,202 | $162,675 |
| 2016 | $4,154 | $341,056 | $181,570 | $159,486 |
| 2015 | $4,114 | $335,934 | $178,843 | $157,091 |
| 2014 | $3,986 | $329,354 | $175,340 | $154,014 |
Source: Public Records
Map
Nearby Homes
- 2400 Elden Ave Unit 12
- 2400 Elden Ave Unit 32
- 158 Cecil Place
- 133 Cecil Place Unit B
- 168 Monte Vista Ave
- 2330 Vanguard Way Unit F102
- 2330 Vanguard Way Unit L101
- 278 Virginia Place
- 2528 Alder Ln
- 2479 Rue de Cannes Unit B2
- 106 Lexington Ln
- 107 Yorktown Ln
- 236 Camellia Ln
- 2338 Bunker Hill Way
- 2554 Elden Ave Unit B102
- 2273 Columbia Dr
- 2234 Avalon St
- 2284 Redlands Dr
- 2408 Minuteman Way
- 157 Yorktown Ln
- 2370 Elden Ave
- 2370 Elden Ave Unit E
- 2370 Elden Ave Unit D
- 2370 Elden Ave Unit C
- 2370 Elden Ave Unit A
- 2370 Elden Ave Unit F
- 159 Georgeanne Place
- 155 Georgeanne Place
- 164 E Wilson St
- 158 E Wilson St
- 172 E Wilson St Unit B
- 172 E Wilson St Unit A
- 172 E Wilson St
- 151 Georgeanne Place
- 163 Georgeanne Place
- 160 Georgeanne Place
- 164 Georgeanne Place
- 154 Georgeanne Place
- 180 E Wilson St
- 2371 Elden Ave Unit B
Your Personal Tour Guide
Ask me questions while you tour the home.