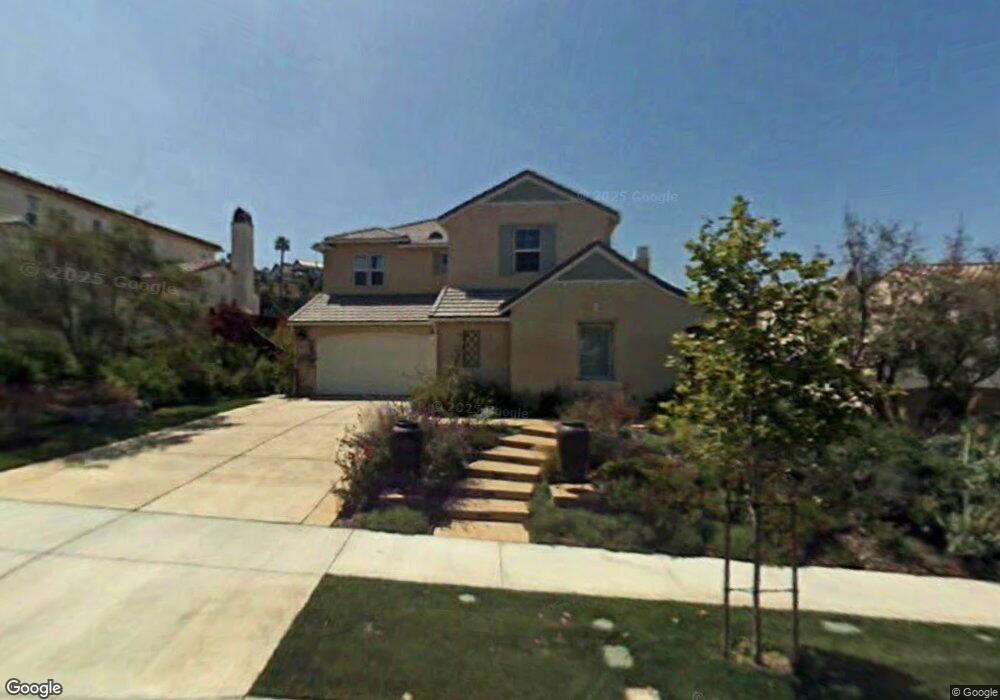
2371 Lapis Rd Carlsbad, CA 92009
La Costa NeighborhoodEstimated Value: $1,942,000 - $2,319,000
4
Beds
5
Baths
3,219
Sq Ft
$664/Sq Ft
Est. Value
About This Home
This home is located at 2371 Lapis Rd, Carlsbad, CA 92009 and is currently estimated at $2,136,917, approximately $663 per square foot. 2371 Lapis Rd is a home located in San Diego County with nearby schools including La Costa Meadows Elementary, San Elijo Middle School, and San Marcos High School.
Ownership History
Date
Name
Owned For
Owner Type
Purchase Details
Closed on
Dec 10, 2025
Sold by
Carman Dwayne and Carman Nora
Bought by
Dwayne And Nora Carman Family Trust and Carman
Current Estimated Value
Purchase Details
Closed on
Nov 20, 2011
Sold by
Attinger William C and Attinger Vaiana N
Bought by
Carman Dwayne and Carman Nora B
Home Financials for this Owner
Home Financials are based on the most recent Mortgage that was taken out on this home.
Original Mortgage
$546,250
Interest Rate
3.94%
Mortgage Type
New Conventional
Purchase Details
Closed on
Feb 1, 2006
Sold by
Western Pacific Housing Inc
Bought by
Attinger William C and Attinger Vaiana N
Home Financials for this Owner
Home Financials are based on the most recent Mortgage that was taken out on this home.
Original Mortgage
$642,350
Interest Rate
7.62%
Mortgage Type
Balloon
Create a Home Valuation Report for This Property
The Home Valuation Report is an in-depth analysis detailing your home's value as well as a comparison with similar homes in the area
Home Values in the Area
Average Home Value in this Area
Purchase History
| Date | Buyer | Sale Price | Title Company |
|---|---|---|---|
| Dwayne And Nora Carman Family Trust | -- | None Listed On Document | |
| Carman Dwayne | -- | None Listed On Document | |
| Carman Dwayne | $801,000 | Advantage Title Inc | |
| Attinger William C | $920,000 | Chicago Title Co |
Source: Public Records
Mortgage History
| Date | Status | Borrower | Loan Amount |
|---|---|---|---|
| Previous Owner | Carman Dwayne | $546,250 | |
| Previous Owner | Attinger William C | $642,350 |
Source: Public Records
Tax History
| Year | Tax Paid | Tax Assessment Tax Assessment Total Assessment is a certain percentage of the fair market value that is determined by local assessors to be the total taxable value of land and additions on the property. | Land | Improvement |
|---|---|---|---|---|
| 2025 | $13,129 | $1,006,090 | $503,045 | $503,045 |
| 2024 | $13,129 | $986,364 | $493,182 | $493,182 |
| 2023 | $12,920 | $967,024 | $483,512 | $483,512 |
| 2022 | $12,744 | $948,064 | $474,032 | $474,032 |
| 2021 | $12,647 | $929,476 | $464,738 | $464,738 |
| 2020 | $12,567 | $919,946 | $459,973 | $459,973 |
| 2019 | $12,519 | $901,908 | $450,954 | $450,954 |
| 2018 | $12,284 | $884,224 | $442,112 | $442,112 |
| 2017 | $12,156 | $866,888 | $433,444 | $433,444 |
| 2016 | $11,992 | $849,892 | $424,946 | $424,946 |
| 2015 | $11,861 | $837,126 | $418,563 | $418,563 |
| 2014 | $11,643 | $820,728 | $410,364 | $410,364 |
Source: Public Records
Map
Nearby Homes
- 6433 La Paloma St
- 2518 Unicornio St
- 6903 Goldstone Rd
- 6705 Antilope St
- 2718 Socorro Ln
- Lot # 258 Luciiernaga St Unit 258
- 6714 Antilope St Unit 1
- 6716 Antilope St Unit 2
- 2647 Cazadero Dr
- 6712 Cantil St
- 2287 Galena Ave
- 6626 Halite Place
- 7146 Argonauta Way
- 2829 Carrillo Way
- 2851 Cebu Place
- 7001 Almaden Ln
- 7133 Obelisco Cir
- 6956 Sandpiper Place
- 6907 Quail Place Unit F
- 6901 Quail Place Unit A
- 2375 Lapis Rd
- 2363 Lapis Rd
- 2379 Lapis Rd
- 6834 Leucite Place
- 2359 Lapis Rd
- 2374 Lapis Rd
- 2383 Lapis Rd
- 6830 Leucite Place
- 6833 Leucite Place
- 6826 Leucite Place
- 2355 Lapis Rd
- 2378 Lapis Rd
- 6829 Leucite Place
- 6822 Leucite Place
- 6825 Leucite Place
- 2354 Lapis Rd
- 2382 Lapis Rd
- 6800 Amber Ln
- 6818 Leucite Place
- 6821 Leucite Place
Your Personal Tour Guide
Ask me questions while you tour the home.