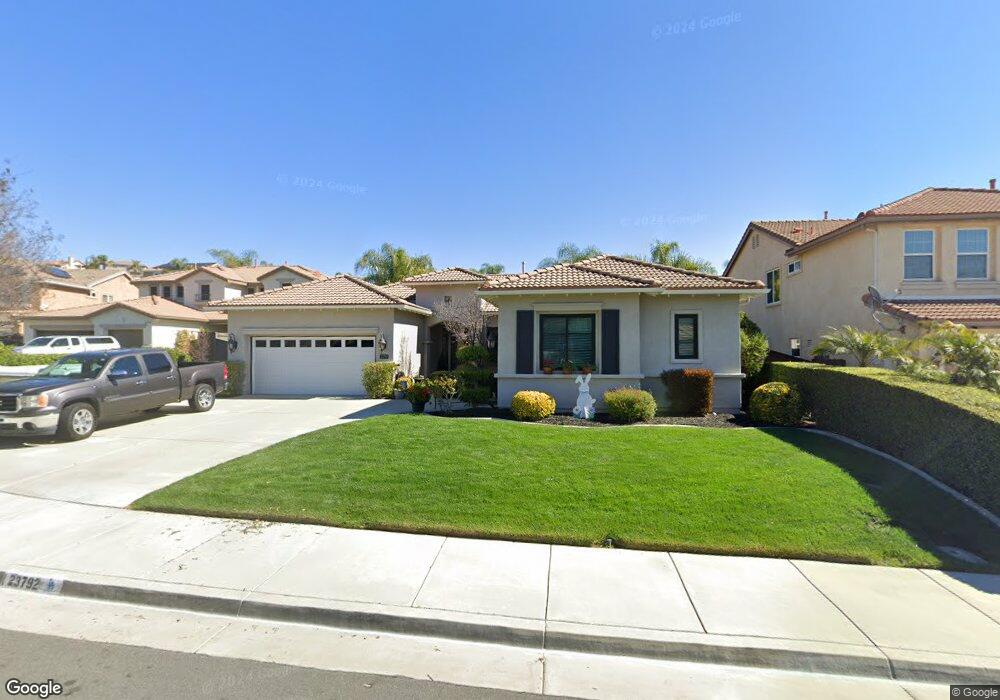
23792 Brookside Ct Murrieta, CA 92562
Estimated Value: $776,000 - $828,000
4
Beds
3
Baths
2,536
Sq Ft
$317/Sq Ft
Est. Value
About This Home
This home is located at 23792 Brookside Ct, Murrieta, CA 92562 and is currently estimated at $803,304, approximately $316 per square foot. 23792 Brookside Ct is a home located in Riverside County with nearby schools including Murrieta Elementary School, Thompson Middle School, and Murrieta Valley High School.
Ownership History
Date
Name
Owned For
Owner Type
Purchase Details
Closed on
Mar 18, 2021
Sold by
Moye Robert M and Byrnes Moye Maura
Bought by
Moye Robert M and Byrnes Moye Maura
Current Estimated Value
Home Financials for this Owner
Home Financials are based on the most recent Mortgage that was taken out on this home.
Original Mortgage
$167,200
Outstanding Balance
$149,959
Interest Rate
2.73%
Mortgage Type
New Conventional
Estimated Equity
$653,345
Purchase Details
Closed on
Jun 25, 2020
Sold by
Moye Robert M and Byrnes Moye Maura
Bought by
Moye Robert M and Byrnes Moye Maura
Purchase Details
Closed on
Jun 4, 2002
Sold by
Murrieta 2001 Llc
Bought by
Moye Robert M and Moye Maura P
Home Financials for this Owner
Home Financials are based on the most recent Mortgage that was taken out on this home.
Original Mortgage
$251,100
Interest Rate
6.17%
Create a Home Valuation Report for This Property
The Home Valuation Report is an in-depth analysis detailing your home's value as well as a comparison with similar homes in the area
Purchase History
| Date | Buyer | Sale Price | Title Company |
|---|---|---|---|
| Moye Robert M | -- | Lawyers Title Sd | |
| Moye Robert M | -- | None Available | |
| Moye Robert M | $314,000 | Chicago Title Co |
Source: Public Records
Mortgage History
| Date | Status | Borrower | Loan Amount |
|---|---|---|---|
| Open | Moye Robert M | $167,200 | |
| Previous Owner | Moye Robert M | $251,100 |
Source: Public Records
Tax History
| Year | Tax Paid | Tax Assessment Tax Assessment Total Assessment is a certain percentage of the fair market value that is determined by local assessors to be the total taxable value of land and additions on the property. | Land | Improvement |
|---|---|---|---|---|
| 2025 | $7,843 | $490,149 | $108,608 | $381,541 |
| 2023 | $7,843 | $471,118 | $104,392 | $366,726 |
| 2022 | $7,791 | $461,882 | $102,346 | $359,536 |
| 2021 | $7,673 | $452,827 | $100,340 | $352,487 |
| 2020 | $7,604 | $448,185 | $99,312 | $348,873 |
| 2019 | $7,490 | $439,398 | $97,365 | $342,033 |
| 2018 | $7,378 | $430,783 | $95,457 | $335,326 |
| 2017 | $7,295 | $422,337 | $93,586 | $328,751 |
| 2016 | $7,216 | $414,056 | $91,751 | $322,305 |
| 2015 | $7,152 | $407,838 | $90,374 | $317,464 |
| 2014 | $6,509 | $364,000 | $81,000 | $283,000 |
Source: Public Records
Map
Nearby Homes
- 41679 Grand View Dr
- 41515 Grand View Dr
- 23717 Ballestros Rd
- 23842 Jonathan Place
- 23677 Ballestros Rd
- 23860 Cadenza Dr
- 41732 Mesquite Ln
- 23377 Mountain Song Loop
- 23401 Rouge River Ln
- 23925 Constantine Dr
- 23832 Barberry Place
- 41871 Dahlias Way
- 23809 Barberry Place
- 23867 Hyacinth Dr
- 24054 Bearskin Cir
- 23427 Mountain Song Loop
- 23457 Mountain Breeze Dr
- 41195 Via Cedro
- 23427 Fern Place
- 24096 Adams Ave
- 23784 Brookside Ct
- 23800 Brookside Ct
- 23795 Hillcrest Ct
- 23776 Brookside Ct
- 23787 Hillcrest Ct
- 23797 Brookside Ct
- 23783 Brookside Ct
- 23768 Brookside Ct
- 41606 Grand View Dr
- 41598 Grand View Dr
- 23779 Hillcrest Ct
- 23775 Brookside Ct
- 41614 Grand View Dr
- 23767 Brookside Ct
- 41590 Grand View Dr
- 23771 Hillcrest Ct
- 41630 Grand View Dr
- 23798 Hillcrest Ct
- 23790 Hillcrest Ct
- 23785 Hillcrest Ct
Your Personal Tour Guide
Ask me questions while you tour the home.