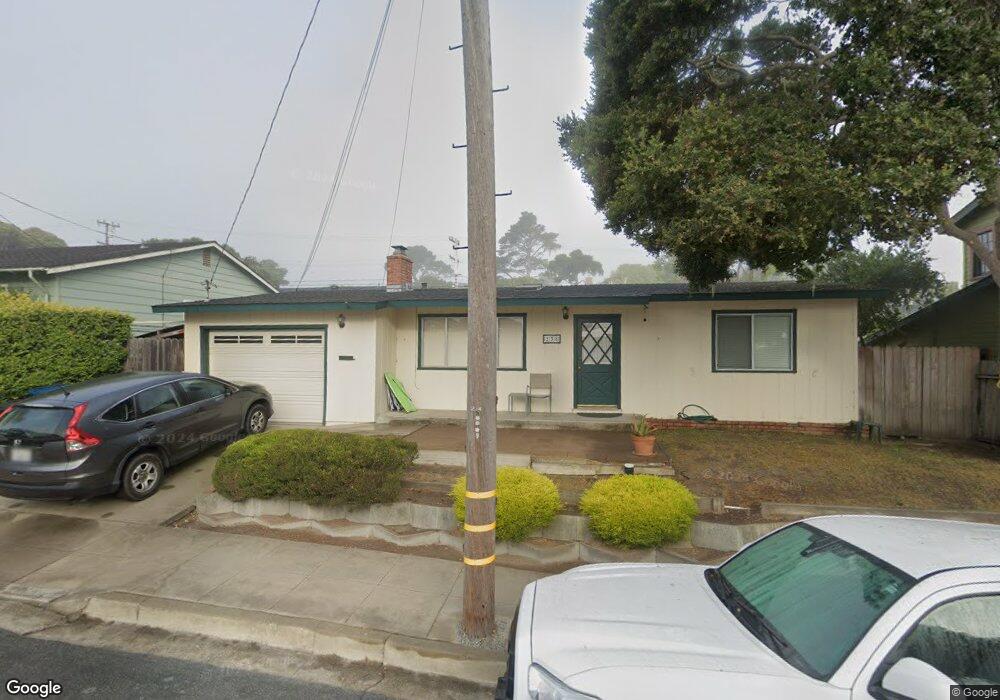
238 Willow St Pacific Grove, CA 93950
Estimated Value: $1,088,920 - $1,559,000
2
Beds
1
Bath
1,110
Sq Ft
$1,203/Sq Ft
Est. Value
About This Home
This home is located at 238 Willow St, Pacific Grove, CA 93950 and is currently estimated at $1,335,230, approximately $1,202 per square foot. 238 Willow St is a home located in Monterey County with nearby schools including Robert Down Elementary School, Pacific Grove Middle School, and Pacific Grove High School.
Ownership History
Date
Name
Owned For
Owner Type
Purchase Details
Closed on
Jun 24, 2005
Sold by
Heh Yung Chung
Bought by
Kennedy Clifford L and Heh Yung Chung
Current Estimated Value
Home Financials for this Owner
Home Financials are based on the most recent Mortgage that was taken out on this home.
Original Mortgage
$359,650
Outstanding Balance
$183,024
Interest Rate
5.37%
Mortgage Type
New Conventional
Estimated Equity
$1,152,206
Purchase Details
Closed on
Jul 21, 1998
Sold by
Nuckton Deryck G and Arnold Earline
Bought by
Kennedy Clifford L and Chung Heh Yung
Home Financials for this Owner
Home Financials are based on the most recent Mortgage that was taken out on this home.
Original Mortgage
$227,150
Interest Rate
7.01%
Mortgage Type
Balloon
Purchase Details
Closed on
Sep 5, 1997
Sold by
Arnold Earline
Bought by
Nuckton Deryck G and Arnold Earline
Create a Home Valuation Report for This Property
The Home Valuation Report is an in-depth analysis detailing your home's value as well as a comparison with similar homes in the area
Home Values in the Area
Average Home Value in this Area
Purchase History
| Date | Buyer | Sale Price | Title Company |
|---|---|---|---|
| Kennedy Clifford L | -- | Fidelity Title | |
| Heh Yung Chung | -- | Fidelity Title | |
| Kennedy Clifford L | -- | Fidelity Title | |
| Kennedy Clifford L | $290,000 | Old Republic Title Company | |
| Nuckton Deryck G | -- | -- |
Source: Public Records
Mortgage History
| Date | Status | Borrower | Loan Amount |
|---|---|---|---|
| Open | Heh Yung Chung | $359,650 | |
| Previous Owner | Kennedy Clifford L | $227,150 |
Source: Public Records
Tax History Compared to Growth
Tax History
| Year | Tax Paid | Tax Assessment Tax Assessment Total Assessment is a certain percentage of the fair market value that is determined by local assessors to be the total taxable value of land and additions on the property. | Land | Improvement |
|---|---|---|---|---|
| 2025 | $4,781 | $454,614 | $344,886 | $109,728 |
| 2024 | $4,781 | $445,701 | $338,124 | $107,577 |
| 2023 | $4,857 | $436,963 | $331,495 | $105,468 |
| 2022 | $4,759 | $428,396 | $324,996 | $103,400 |
| 2021 | $4,735 | $419,997 | $318,624 | $101,373 |
| 2020 | $4,640 | $415,691 | $315,357 | $100,334 |
| 2019 | $4,493 | $407,541 | $309,174 | $98,367 |
| 2018 | $4,406 | $399,551 | $303,112 | $96,439 |
| 2017 | $4,334 | $391,718 | $297,169 | $94,549 |
| 2016 | $4,344 | $384,039 | $291,343 | $92,696 |
| 2015 | $4,274 | $378,271 | $286,967 | $91,304 |
| 2014 | $4,185 | $370,862 | $281,346 | $89,516 |
Source: Public Records
Map
Nearby Homes
- 311 Walnut St
- 222 Wood St
- 311 Lobos Ave
- 206 Cypress Ave Unit B
- 791 Spruce Ave
- 810 Lighthouse Ave Unit 101
- 311 Congress Ave
- 302 Park St
- 851 Bayview Ave
- 705 Union St
- 735 Bayview Ave
- 820 - 822 Cedar St
- 765 Gibson Ave
- 224 16th St
- 910 Egan Ave
- 127 16th St
- 132 Forest Ave
- 304 Grove Acre Ave
- 618 Forest Ave
- 542 Lighthouse Ave Unit 301