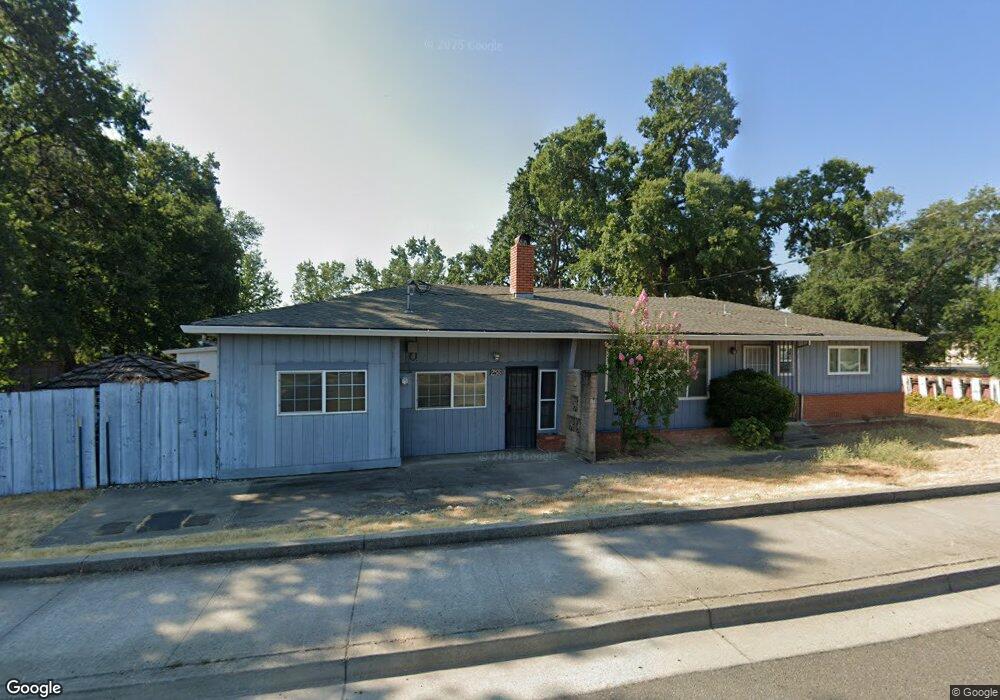
2381 S Bonnyview Rd Redding, CA 96001
Girvan NeighborhoodEstimated Value: $274,020 - $561,000
5
Beds
4
Baths
2,000
Sq Ft
$224/Sq Ft
Est. Value
About This Home
This home is located at 2381 S Bonnyview Rd, Redding, CA 96001 and is currently estimated at $448,005, approximately $224 per square foot. 2381 S Bonnyview Rd is a home located in Shasta County with nearby schools including Bonny View Elementary School, Sequoia Middle School, and Shasta High School.
Ownership History
Date
Name
Owned For
Owner Type
Purchase Details
Closed on
Aug 31, 2007
Sold by
Frunk Dennis A and Frunk Larrie C
Bought by
Frunk Dennis A and Frunk Larrie C
Current Estimated Value
Purchase Details
Closed on
Oct 15, 2003
Sold by
Frunk Dennis A and Frunk Larrie C
Bought by
Frunk Dennis A and Frunk Larrie C
Home Financials for this Owner
Home Financials are based on the most recent Mortgage that was taken out on this home.
Original Mortgage
$148,800
Outstanding Balance
$69,105
Interest Rate
6.14%
Mortgage Type
Purchase Money Mortgage
Estimated Equity
$378,900
Purchase Details
Closed on
Jan 16, 2001
Sold by
Homecomings Financial Network Inc
Bought by
Frunk Dennis and Frunk Larrie
Home Financials for this Owner
Home Financials are based on the most recent Mortgage that was taken out on this home.
Original Mortgage
$85,500
Interest Rate
7.08%
Purchase Details
Closed on
Apr 18, 2000
Sold by
Smith Alva L
Bought by
Tms Mtg Inc
Create a Home Valuation Report for This Property
The Home Valuation Report is an in-depth analysis detailing your home's value as well as a comparison with similar homes in the area
Home Values in the Area
Average Home Value in this Area
Purchase History
| Date | Buyer | Sale Price | Title Company |
|---|---|---|---|
| Frunk Dennis A | -- | Chicago Title Co | |
| Frunk Dennis A | -- | First American Title Co | |
| Frunk Dennis | $95,000 | Fidelity National Title Co | |
| Tms Mtg Inc | $100,252 | -- |
Source: Public Records
Mortgage History
| Date | Status | Borrower | Loan Amount |
|---|---|---|---|
| Open | Frunk Dennis A | $148,800 | |
| Closed | Frunk Dennis | $85,500 |
Source: Public Records
Tax History Compared to Growth
Tax History
| Year | Tax Paid | Tax Assessment Tax Assessment Total Assessment is a certain percentage of the fair market value that is determined by local assessors to be the total taxable value of land and additions on the property. | Land | Improvement |
|---|---|---|---|---|
| 2025 | $1,520 | $143,126 | $75,330 | $67,796 |
| 2024 | $1,497 | $140,320 | $73,853 | $66,467 |
| 2023 | $1,497 | $137,569 | $72,405 | $65,164 |
| 2022 | $1,472 | $134,873 | $70,986 | $63,887 |
| 2021 | $1,464 | $132,230 | $69,595 | $62,635 |
| 2020 | $1,483 | $130,875 | $68,882 | $61,993 |
| 2019 | $1,409 | $128,310 | $67,532 | $60,778 |
| 2018 | $1,421 | $125,795 | $66,208 | $59,587 |
| 2017 | $1,413 | $123,329 | $64,910 | $58,419 |
| 2016 | $1,369 | $120,912 | $63,638 | $57,274 |
| 2015 | $1,352 | $119,097 | $62,683 | $56,414 |
| 2014 | $1,343 | $116,765 | $61,456 | $55,309 |
Source: Public Records
Map
Nearby Homes
- 2200 Jewell Ln
- 2339 North Dr
- 5812 Cedars Rd Unit 36
- 5812 Cedars Rd Unit 3
- 5750 Cedars Rd
- 6405 El Camino Dr
- 2048 Wilder Dr
- 2079 Wilder Dr
- 2006 Wilder Dr
- 0 Waverly Manor
- 6494 Leonard Dr
- 2541 Center Waverly Ave
- 3385 Pioneer Ln
- 5211 E Bonnyview Rd
- 3200 Miramar Way
- 6955 Yvonne Ct
- 6871 Hemlock St
- 6951 Marvin Trail
- 2396 Wilsey Dr
- 7060 Pit Rd
- 2361 S Bonnyview Rd
- 2321 S Bonnyview Rd
- 6179 Eastside Rd
- 6065 Eastside Rd
- 5055 Eastside Rd
- 6485 Eastside Rd
- 6775 Eastside Rd
- 4065 Eastside Rd
- 5885 Eastside Rd
- 2400 S Bonnyview Rd
- 2400 S Bonnyview Rd
- 5875 Eastside Rd
- 2330 S Bonnyview Rd
- 5971 Cedars Rd
- 2570 S Bonnyview Rd
- 5950 Cedars Rd
- 2568 S Bonnyview Rd
- 2371 Heryford Ln
- 5781 Eastside Rd
- 5830 Westside Rd