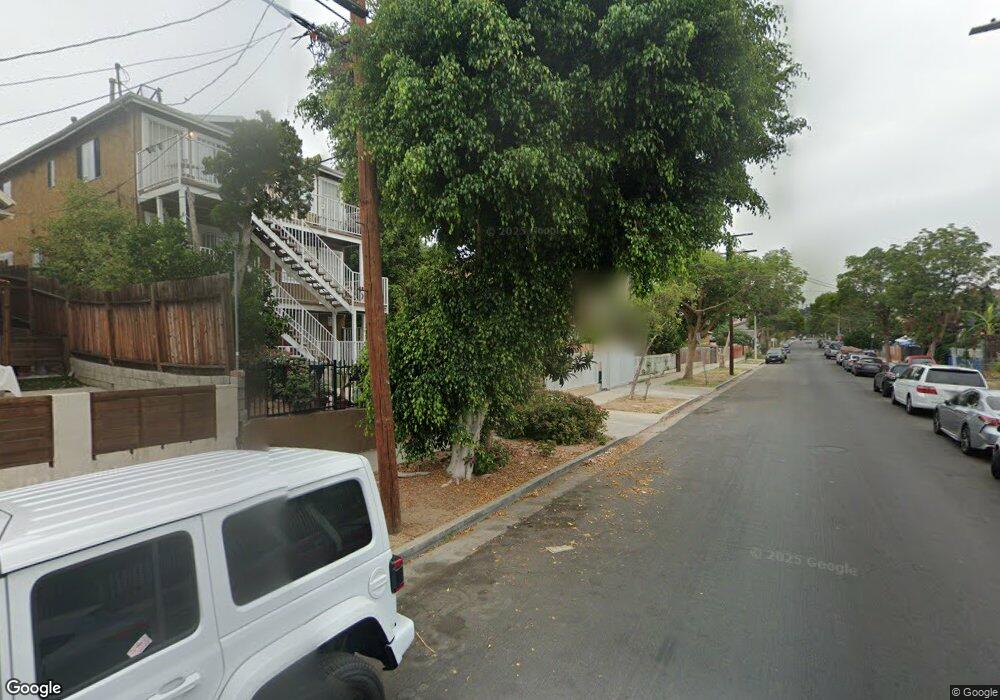
239 N Mountain View Ave Los Angeles, CA 90026
Westlake NeighborhoodEstimated Value: $1,023,000 - $1,147,648
3
Beds
2
Baths
1,820
Sq Ft
$586/Sq Ft
Est. Value
About This Home
This home is located at 239 N Mountain View Ave, Los Angeles, CA 90026 and is currently estimated at $1,067,162, approximately $586 per square foot. 239 N Mountain View Ave is a home located in Los Angeles County with nearby schools including Rosemont Avenue Elementary School, Sal Castro Middle School, and Belmont High School.
Ownership History
Date
Name
Owned For
Owner Type
Purchase Details
Closed on
Dec 11, 2007
Sold by
Santos Nidia Delrosario
Bought by
Santos Nidia Delrosario
Current Estimated Value
Home Financials for this Owner
Home Financials are based on the most recent Mortgage that was taken out on this home.
Original Mortgage
$404,000
Outstanding Balance
$255,186
Interest Rate
6.26%
Mortgage Type
Purchase Money Mortgage
Estimated Equity
$811,976
Purchase Details
Closed on
Nov 30, 2007
Sold by
Davis John A
Bought by
Santos Nidia Del Rosario
Home Financials for this Owner
Home Financials are based on the most recent Mortgage that was taken out on this home.
Original Mortgage
$404,000
Outstanding Balance
$255,186
Interest Rate
6.26%
Mortgage Type
Purchase Money Mortgage
Estimated Equity
$811,976
Create a Home Valuation Report for This Property
The Home Valuation Report is an in-depth analysis detailing your home's value as well as a comparison with similar homes in the area
Home Values in the Area
Average Home Value in this Area
Purchase History
| Date | Buyer | Sale Price | Title Company |
|---|---|---|---|
| Santos Nidia Delrosario | -- | None Available | |
| Santos Nidia Del Rosario | $505,000 | Fatcola |
Source: Public Records
Mortgage History
| Date | Status | Borrower | Loan Amount |
|---|---|---|---|
| Open | Santos Nidia Del Rosario | $404,000 |
Source: Public Records
Tax History Compared to Growth
Tax History
| Year | Tax Paid | Tax Assessment Tax Assessment Total Assessment is a certain percentage of the fair market value that is determined by local assessors to be the total taxable value of land and additions on the property. | Land | Improvement |
|---|---|---|---|---|
| 2025 | $7,999 | $663,309 | $623,913 | $39,396 |
| 2024 | $7,999 | $650,304 | $611,680 | $38,624 |
| 2023 | $7,848 | $637,554 | $599,687 | $37,867 |
| 2022 | $7,487 | $625,054 | $587,929 | $37,125 |
| 2021 | $7,386 | $612,799 | $576,401 | $36,398 |
| 2019 | $7,165 | $594,624 | $559,305 | $35,319 |
| 2018 | $7,105 | $582,966 | $548,339 | $34,627 |
| 2016 | $6,784 | $560,332 | $527,048 | $33,284 |
| 2015 | $4,636 | $380,000 | $357,400 | $22,600 |
| 2014 | $3,992 | $318,000 | $299,100 | $18,900 |
Source: Public Records
Map
Nearby Homes
- 250 N Alvarado St Unit 3/4
- 125 N Mountain View Ave
- 251 N Burlington Ave
- 425 N Westlake Ave
- 333 N Union Ave
- 142 S Mountain View Ave
- 434 N Lake St
- 151 S Mountain View Ave
- 119 Rosemont Ave Unit 3/4
- 216 S Lake St
- 334 Belmont Ave
- 2305 W 2nd St
- 230 N Park View St
- 2227 Valley St
- 2021 Miramar St
- 2330 W 2nd St
- 2005 Bellevue Ave
- 2007 Bellevue Ave
- 606 N Bonnie Brae St
- 326 Welcome St
- 235 N Mountain View Ave
- 243 N Mountain View Ave
- 231 N Mountain View Ave
- 247 N Mountain View Ave
- 227 N Mountain View Ave
- 227 1/2 N Mountain View Ave
- 230 N Alvarado St
- 224 N Alvarado St Unit 503A
- 224 N Alvarado St Unit 305A
- 224 N Alvarado St Unit 402A
- 224 N Alvarado St Unit 303A
- 224 N Alvarado St Unit 103A
- 224 N Alvarado St Unit 502A
- 224 N Alvarado St
- 234 N Alvarado St
- 251 N Mountain View Ave
- 222 N Alvarado St Unit 208
- 236 N Alvarado St
- 223 N Mountain View Ave
- 248 N Mountain View Ave