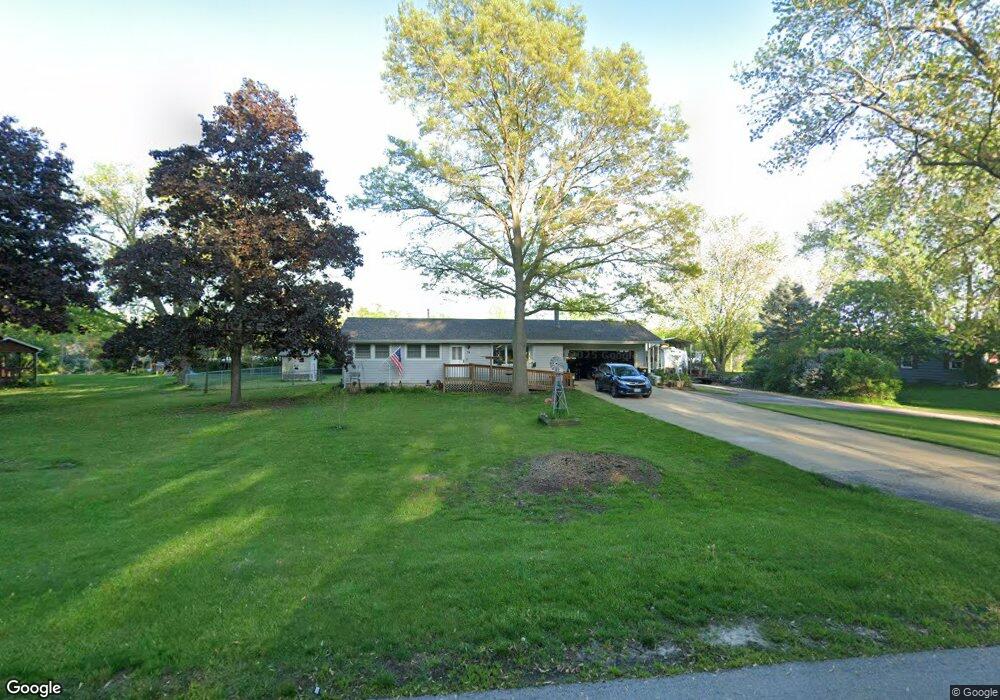
24 N Cherry Dr Oswego, IL 60543
Northwest Oswego NeighborhoodEstimated Value: $312,000 - $369,000
3
Beds
1
Bath
1,232
Sq Ft
$272/Sq Ft
Est. Value
About This Home
This home is located at 24 N Cherry Dr, Oswego, IL 60543 and is currently estimated at $335,383, approximately $272 per square foot. 24 N Cherry Dr is a home located in Kendall County with nearby schools including Fox Chase Elementary School, Traughber Junior High School, and Oswego High School.
Ownership History
Date
Name
Owned For
Owner Type
Purchase Details
Closed on
Dec 29, 2023
Sold by
Cunningham Revocable Liivng Trust
Bought by
Cunningham Carol J
Current Estimated Value
Purchase Details
Closed on
Nov 4, 2010
Sold by
Cunningham Clarence L and Cunningham Kathryn L
Bought by
Cunningham Revocable Living Trust
Purchase Details
Closed on
Oct 25, 2010
Sold by
Secretary Of Housing & Urban Development
Bought by
Cunningham Clarence L and Cunningham Kathryn L
Purchase Details
Closed on
Apr 28, 2010
Sold by
Gossett Jeremy
Bought by
Secretary Of Housing & Urban Development
Purchase Details
Closed on
May 16, 2008
Sold by
Homer Thomas J
Bought by
Gossett Jeremy
Home Financials for this Owner
Home Financials are based on the most recent Mortgage that was taken out on this home.
Original Mortgage
$188,541
Interest Rate
5.87%
Mortgage Type
FHA
Create a Home Valuation Report for This Property
The Home Valuation Report is an in-depth analysis detailing your home's value as well as a comparison with similar homes in the area
Home Values in the Area
Average Home Value in this Area
Purchase History
| Date | Buyer | Sale Price | Title Company |
|---|---|---|---|
| Cunningham Carol J | -- | None Listed On Document | |
| Cunningham Revocable Living Trust | -- | Chicago Title Insurance Co | |
| Cunningham Clarence L | -- | Stewart Title Company | |
| Secretary Of Housing & Urban Development | -- | None Available | |
| Gossett Jeremy | $191,500 | Attorneys Title Guaranty Fun |
Source: Public Records
Mortgage History
| Date | Status | Borrower | Loan Amount |
|---|---|---|---|
| Previous Owner | Gossett Jeremy | $188,541 |
Source: Public Records
Tax History
| Year | Tax Paid | Tax Assessment Tax Assessment Total Assessment is a certain percentage of the fair market value that is determined by local assessors to be the total taxable value of land and additions on the property. | Land | Improvement |
|---|---|---|---|---|
| 2024 | $7,399 | $99,475 | $24,394 | $75,081 |
| 2023 | $5,484 | $86,500 | $21,212 | $65,288 |
| 2022 | $5,484 | $84,804 | $20,796 | $64,008 |
| 2021 | $5,683 | $77,094 | $18,905 | $58,189 |
| 2020 | $0 | $72,730 | $17,835 | $54,895 |
| 2019 | $5,832 | $72,730 | $17,835 | $54,895 |
| 2018 | $6,075 | $72,730 | $17,835 | $54,895 |
| 2017 | $5,627 | $66,724 | $16,362 | $50,362 |
| 2016 | $2,423 | $64,780 | $15,885 | $48,895 |
| 2015 | $2,442 | $62,893 | $15,422 | $47,471 |
| 2014 | -- | $59,333 | $14,549 | $44,784 |
| 2013 | -- | $59,932 | $14,696 | $45,236 |
Source: Public Records
Map
Nearby Homes
- 130 W Harvest Ct
- 187 Eisenhower Dr
- 114 Riverview Ct
- 125 Presidential Blvd Unit 3248
- 505 Parkland Ct
- 548 Arbor Ln
- 268 S Adams St
- 38 Walnut Creek Ln
- 238 Cooney Way
- 239 Cooney Way
- 403 Tanya Ln
- 343 Danforth Dr
- 713 Erwin St
- 251 Cooney Way
- 236 Cooney Way
- 237 Cooney Way
- 316 Ash Grove Ln
- 371 S Madison St
- 238 Willowwood Dr
- 2240 State Route 31
Your Personal Tour Guide
Ask me questions while you tour the home.