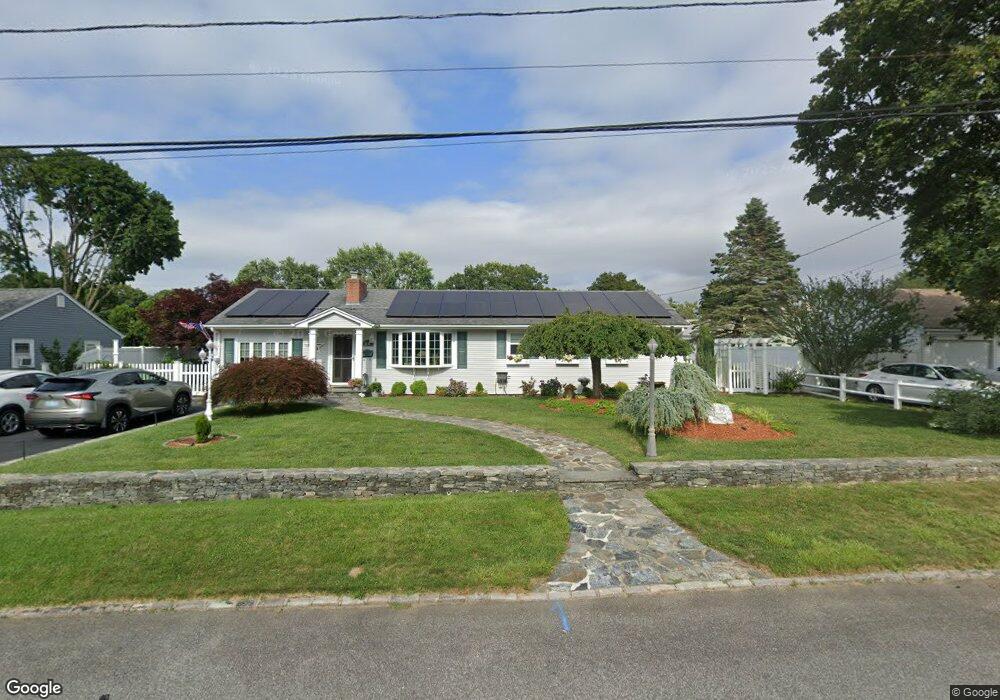
24 Rancocos Dr Warwick, RI 02888
Palace Garden NeighborhoodEstimated Value: $488,000 - $535,000
3
Beds
2
Baths
1,512
Sq Ft
$336/Sq Ft
Est. Value
About This Home
This home is located at 24 Rancocos Dr, Warwick, RI 02888 and is currently estimated at $508,635, approximately $336 per square foot. 24 Rancocos Dr is a home located in Kent County with nearby schools including St. Peter School and Saint Paul School.
Ownership History
Date
Name
Owned For
Owner Type
Purchase Details
Closed on
Jul 11, 2003
Sold by
Lombardozzi Joseph P
Bought by
Grinnell David and Grinnell Carolyn
Current Estimated Value
Home Financials for this Owner
Home Financials are based on the most recent Mortgage that was taken out on this home.
Original Mortgage
$169,600
Outstanding Balance
$71,883
Interest Rate
5.45%
Mortgage Type
Purchase Money Mortgage
Estimated Equity
$436,752
Create a Home Valuation Report for This Property
The Home Valuation Report is an in-depth analysis detailing your home's value as well as a comparison with similar homes in the area
Home Values in the Area
Average Home Value in this Area
Purchase History
| Date | Buyer | Sale Price | Title Company |
|---|---|---|---|
| Grinnell David | $212,000 | -- |
Source: Public Records
Mortgage History
| Date | Status | Borrower | Loan Amount |
|---|---|---|---|
| Closed | Grinnell David | $60,000 | |
| Closed | Grinnell David | $40,000 | |
| Open | Grinnell David | $169,600 |
Source: Public Records
Tax History Compared to Growth
Tax History
| Year | Tax Paid | Tax Assessment Tax Assessment Total Assessment is a certain percentage of the fair market value that is determined by local assessors to be the total taxable value of land and additions on the property. | Land | Improvement |
|---|---|---|---|---|
| 2025 | $5,394 | $424,700 | $150,000 | $274,700 |
| 2024 | $5,410 | $373,900 | $130,400 | $243,500 |
| 2023 | $5,306 | $373,900 | $130,400 | $243,500 |
| 2022 | $5,179 | $276,500 | $92,700 | $183,800 |
| 2021 | $5,179 | $276,500 | $92,700 | $183,800 |
| 2020 | $5,173 | $276,200 | $92,700 | $183,500 |
| 2019 | $5,173 | $276,200 | $92,700 | $183,500 |
| 2018 | $4,520 | $217,300 | $86,100 | $131,200 |
| 2017 | $4,398 | $217,300 | $86,100 | $131,200 |
| 2016 | $4,398 | $217,300 | $86,100 | $131,200 |
| 2015 | $4,117 | $198,400 | $82,600 | $115,800 |
| 2014 | $3,980 | $198,400 | $82,600 | $115,800 |
| 2013 | $3,926 | $198,400 | $82,600 | $115,800 |
Source: Public Records
Map
Nearby Homes
- 25 Honeysuckle Rd
- 165 Merrymount Dr
- 375 Namquid Dr
- 6 Black Creek Ln
- 48 Lane 2
- 179 Lane 4
- 86 Lane 5
- 922 Narragansett Pkwy
- 68 Lane 5
- 293 Parkside Dr
- 117 Spring Green Rd
- 788 Namquid Dr
- 41 Drake Rd
- 161 N Country Club Dr
- 19 Independence Dr
- 600 Cole Farm Rd
- 58 Canna St
- 400 Cole Farm Rd
- 23 Stoddard Place
- 30 Archdale Dr