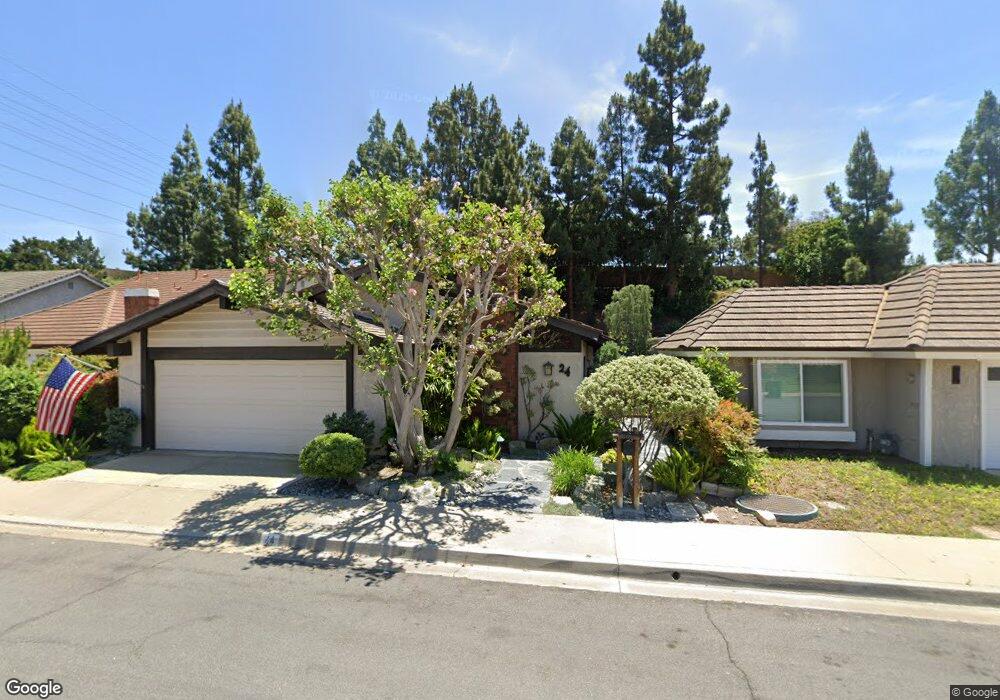
24 Sanderling Irvine, CA 92604
Walnut NeighborhoodEstimated Value: $1,354,757 - $1,423,000
3
Beds
2
Baths
1,719
Sq Ft
$810/Sq Ft
Est. Value
About This Home
This home is located at 24 Sanderling, Irvine, CA 92604 and is currently estimated at $1,392,689, approximately $810 per square foot. 24 Sanderling is a home located in Orange County with nearby schools including Deerfield Elementary School, Venado Middle School, and Irvine High School.
Ownership History
Date
Name
Owned For
Owner Type
Purchase Details
Closed on
Apr 25, 2012
Sold by
Mchugh Margaret
Bought by
Mchugh Margaret and The Mchugh Family Trust
Current Estimated Value
Purchase Details
Closed on
Apr 24, 1998
Sold by
Mchugh James F and Mchugh Margaret
Bought by
Mchugh James F and Mchugh Margaret
Home Financials for this Owner
Home Financials are based on the most recent Mortgage that was taken out on this home.
Original Mortgage
$144,000
Interest Rate
7.06%
Purchase Details
Closed on
Mar 23, 1998
Sold by
Mchugh James F and Mchugh Margaret
Bought by
Mchugh James F and Mchugh Margaret
Home Financials for this Owner
Home Financials are based on the most recent Mortgage that was taken out on this home.
Original Mortgage
$144,000
Interest Rate
7.06%
Create a Home Valuation Report for This Property
The Home Valuation Report is an in-depth analysis detailing your home's value as well as a comparison with similar homes in the area
Home Values in the Area
Average Home Value in this Area
Purchase History
| Date | Buyer | Sale Price | Title Company |
|---|---|---|---|
| Mchugh Margaret | -- | None Available | |
| Mchugh Margaret | -- | None Available | |
| Mchugh James F | -- | -- | |
| Mchugh James F | -- | United Title Company |
Source: Public Records
Mortgage History
| Date | Status | Borrower | Loan Amount |
|---|---|---|---|
| Closed | Mchugh James F | $144,000 |
Source: Public Records
Tax History
| Year | Tax Paid | Tax Assessment Tax Assessment Total Assessment is a certain percentage of the fair market value that is determined by local assessors to be the total taxable value of land and additions on the property. | Land | Improvement |
|---|---|---|---|---|
| 2025 | $1,774 | $158,814 | $55,982 | $102,832 |
| 2024 | $1,774 | $155,700 | $54,884 | $100,816 |
| 2023 | $1,727 | $152,648 | $53,808 | $98,840 |
| 2022 | $1,683 | $149,655 | $52,753 | $96,902 |
| 2021 | $1,640 | $146,721 | $51,719 | $95,002 |
| 2020 | $1,630 | $145,217 | $51,189 | $94,028 |
| 2019 | $1,592 | $142,370 | $50,185 | $92,185 |
| 2018 | $1,560 | $139,579 | $49,201 | $90,378 |
| 2017 | $1,526 | $136,843 | $48,237 | $88,606 |
| 2016 | $1,463 | $134,160 | $47,291 | $86,869 |
| 2015 | $1,441 | $132,145 | $46,580 | $85,565 |
| 2014 | $1,414 | $129,557 | $45,668 | $83,889 |
Source: Public Records
Map
Nearby Homes
- 14921 Pinehaven Rd
- 7 Timberline
- 3 Sunset River
- 5101 Chateau Cir
- 18 Brookdale
- 14592 Highcrest Cir
- 57 Pinewood Unit 29
- 32 Goldenbush
- 15231 Touraine Way
- 17 Blazing Star
- 10 Pinewood
- 95 Wildwood Unit 40
- 45 Golden Glen St Unit 75
- 14851 Jeffrey Rd Unit 69
- 14851 Jeffrey Rd Unit 61
- 14851 Jeffrey Rd Unit 192
- 14851 Jeffrey Rd Unit 241
- 14851 Jeffrey Rd Unit 145
- 14851 Jeffrey Rd Unit 246
- 14851 Jeffrey Rd Unit 7
Your Personal Tour Guide
Ask me questions while you tour the home.