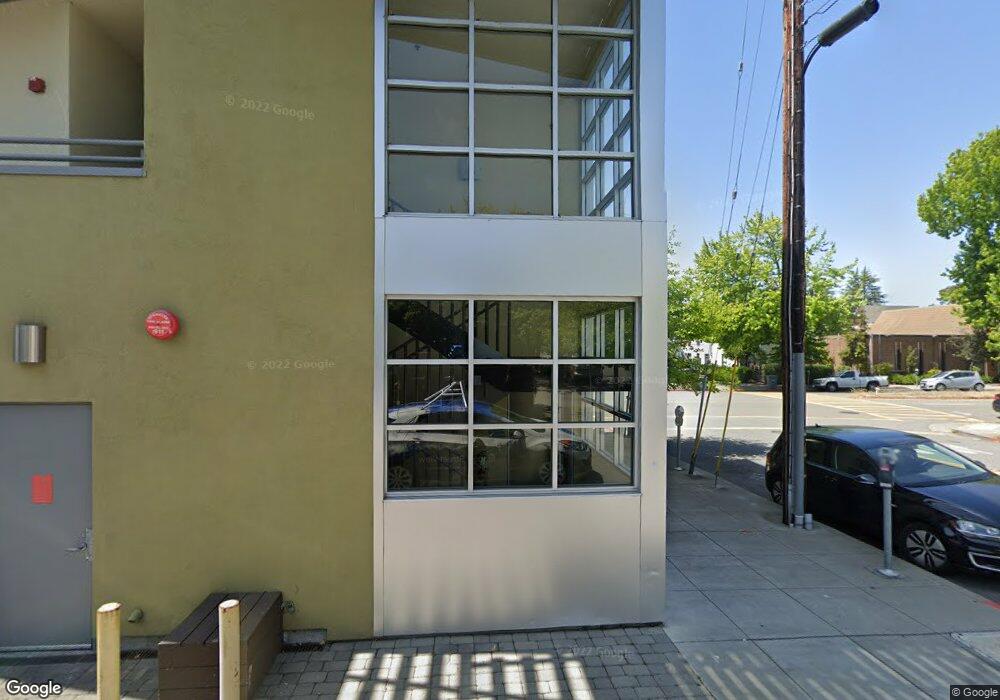
2400 Dowling Place Unit 2 Berkeley, CA 94705
Elmwood NeighborhoodEstimated Value: $613,186 - $795,000
1
Bed
1
Bath
973
Sq Ft
$714/Sq Ft
Est. Value
About This Home
This home is located at 2400 Dowling Place Unit 2, Berkeley, CA 94705 and is currently estimated at $695,047, approximately $714 per square foot. 2400 Dowling Place Unit 2 is a home located in Alameda County with nearby schools including Emerson Elementary School, Malcolm X Elementary School, and John Muir Elementary School.
Ownership History
Date
Name
Owned For
Owner Type
Purchase Details
Closed on
Mar 14, 2015
Sold by
Rossen Steven D
Bought by
Colker Stephanie M
Current Estimated Value
Home Financials for this Owner
Home Financials are based on the most recent Mortgage that was taken out on this home.
Original Mortgage
$140,000
Interest Rate
3.77%
Mortgage Type
New Conventional
Purchase Details
Closed on
Jul 19, 2006
Sold by
3075 Telegraph Llc
Bought by
Rossen Steven D
Home Financials for this Owner
Home Financials are based on the most recent Mortgage that was taken out on this home.
Original Mortgage
$27,950
Interest Rate
6.76%
Mortgage Type
Purchase Money Mortgage
Create a Home Valuation Report for This Property
The Home Valuation Report is an in-depth analysis detailing your home's value as well as a comparison with similar homes in the area
Home Values in the Area
Average Home Value in this Area
Purchase History
| Date | Buyer | Sale Price | Title Company |
|---|---|---|---|
| Colker Stephanie M | $377,000 | Chicago Title Company | |
| Rossen Steven D | $280,000 | First American Title Co |
Source: Public Records
Mortgage History
| Date | Status | Borrower | Loan Amount |
|---|---|---|---|
| Previous Owner | Colker Stephanie M | $140,000 | |
| Previous Owner | Rossen Steven D | $27,950 |
Source: Public Records
Tax History Compared to Growth
Tax History
| Year | Tax Paid | Tax Assessment Tax Assessment Total Assessment is a certain percentage of the fair market value that is determined by local assessors to be the total taxable value of land and additions on the property. | Land | Improvement |
|---|---|---|---|---|
| 2025 | $6,997 | $446,081 | $180,271 | $272,810 |
| 2024 | $6,997 | $437,199 | $176,737 | $267,462 |
| 2023 | $6,847 | $435,491 | $173,272 | $262,219 |
| 2022 | $6,721 | $419,952 | $169,875 | $257,077 |
| 2021 | $6,731 | $411,583 | $166,545 | $252,038 |
| 2020 | $6,378 | $414,292 | $164,838 | $249,454 |
| 2019 | $6,133 | $406,172 | $161,607 | $244,565 |
| 2018 | $6,028 | $398,210 | $158,439 | $239,771 |
| 2017 | $5,803 | $390,401 | $155,332 | $235,069 |
| 2016 | $5,614 | $382,748 | $152,287 | $230,461 |
| 2015 | $4,740 | $311,568 | $93,470 | $218,098 |
| 2014 | $4,702 | $305,467 | $91,640 | $213,827 |
Source: Public Records
Map
Nearby Homes
- 2243 Ashby Ave
- 6446 Colby St
- 2477 Prince St
- 629 66th St
- 2110 Ashby Ave
- 3050 Shattuck Ave
- 6555 Shattuck Ave
- 2057 Emerson St
- 669 Alcatraz Ave
- 2918 Newbury St
- 2702 Dana St
- 6320 Shattuck Ave
- 2401 Carleton St
- 619 62nd St
- 2951 Linden Ave
- 2543 Chilton Way
- 2537 Ellsworth St
- 2316 Blake St Unit D
- 2550 Dana St Unit 2F
- 3033 Ellis St Unit B
- 2400 Dowling Place
- 2400 Dowling Place Unit 9
- 2400 Dowling Place Unit 8
- 2400 Dowling Place Unit 5
- 2400 Dowling Place Unit 4
- 2400 Dowling Place Unit 3
- 2400 Dowling Place Unit 1
- 2400 Dowling Place Unit 10
- 2413 Prince St
- 2410 Dowling Place
- 2414 Dowling Place
- 2417 Prince St
- 3046 Telegraph Ave Unit 3
- 3046 Telegraph Ave Unit 2
- 3046 Telegraph Ave
- 3046 Telegraph Ave Unit 1
- 2419 Prince St
- 2416 Dowling Place
- 2407 Dowling Place
- 2421 Prince St