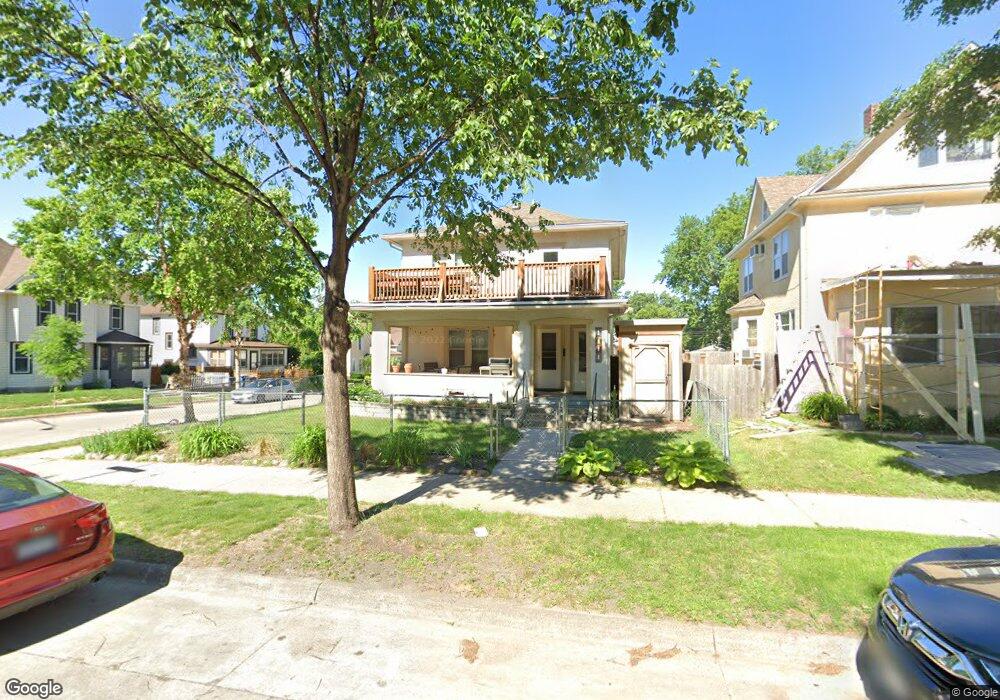
2400 Fillmore St NE Minneapolis, MN 55418
Windom Park NeighborhoodEstimated Value: $382,864 - $456,000
3
Beds
2
Baths
1,848
Sq Ft
$223/Sq Ft
Est. Value
About This Home
This home is located at 2400 Fillmore St NE, Minneapolis, MN 55418 and is currently estimated at $411,716, approximately $222 per square foot. 2400 Fillmore St NE is a home located in Hennepin County with nearby schools including Pillsbury Elementary School, Northeast Middle School, and Thomas Edison High School.
Ownership History
Date
Name
Owned For
Owner Type
Purchase Details
Closed on
Jan 30, 2024
Sold by
Taylor Alexandra
Bought by
River & Rail Properties Llc
Current Estimated Value
Purchase Details
Closed on
Oct 7, 2019
Sold by
Murray Jessica M and Murray Andrew C
Bought by
Taylor Alexandra
Home Financials for this Owner
Home Financials are based on the most recent Mortgage that was taken out on this home.
Original Mortgage
$337,250
Interest Rate
3.5%
Mortgage Type
New Conventional
Purchase Details
Closed on
Jan 3, 2012
Sold by
Green Sean R
Bought by
Mcmahon Jessica M
Home Financials for this Owner
Home Financials are based on the most recent Mortgage that was taken out on this home.
Original Mortgage
$151,070
Interest Rate
3.75%
Mortgage Type
FHA
Purchase Details
Closed on
Jan 29, 1999
Sold by
Kern Michael J
Bought by
Green Sean R and Lafond Tracy M
Create a Home Valuation Report for This Property
The Home Valuation Report is an in-depth analysis detailing your home's value as well as a comparison with similar homes in the area
Home Values in the Area
Average Home Value in this Area
Purchase History
| Date | Buyer | Sale Price | Title Company |
|---|---|---|---|
| River & Rail Properties Llc | $500 | None Listed On Document | |
| Taylor Alexandra | $355,000 | Titlesmart Inc | |
| Mcmahon Jessica M | $155,000 | First American Title | |
| Green Sean R | $105,000 | -- |
Source: Public Records
Mortgage History
| Date | Status | Borrower | Loan Amount |
|---|---|---|---|
| Previous Owner | Taylor Alexandra | $337,250 | |
| Previous Owner | Mcmahon Jessica M | $151,070 |
Source: Public Records
Tax History Compared to Growth
Tax History
| Year | Tax Paid | Tax Assessment Tax Assessment Total Assessment is a certain percentage of the fair market value that is determined by local assessors to be the total taxable value of land and additions on the property. | Land | Improvement |
|---|---|---|---|---|
| 2024 | $5,727 | $395,000 | $101,000 | $294,000 |
| 2023 | $5,136 | $395,000 | $101,000 | $294,000 |
| 2022 | $4,824 | $380,000 | $98,000 | $282,000 |
| 2021 | $3,740 | $353,000 | $44,000 | $309,000 |
| 2020 | $3,498 | $289,500 | $29,600 | $259,900 |
| 2019 | $4,193 | $254,000 | $19,700 | $234,300 |
| 2018 | $3,814 | $231,000 | $19,700 | $211,300 |
| 2017 | $3,374 | $180,000 | $17,900 | $162,100 |
| 2016 | $3,317 | $171,500 | $17,900 | $153,600 |
| 2015 | $3,074 | $151,500 | $17,900 | $133,600 |
| 2014 | -- | $134,500 | $17,900 | $116,600 |
Source: Public Records
Map
Nearby Homes
- 1104 24th Ave NE
- 2307 Fillmore St NE
- 1010 23rd Ave NE
- 2512 Buchanan St NE
- 1014 26th Ave NE
- 1000 26th Ave NE
- 2219 Lincoln St NE
- 1001 26th Ave NE
- 1943 Lincoln St NE
- 2623 Polk St NE
- 2637 Taylor St NE
- 909 22nd Ave NE
- 2639 NE Jackson St
- 1834 Fillmore St NE
- 2635 Polk St NE
- 2209 Jackson St NE
- 1847 Buchanan St NE
- 2619 Lincoln St NE
- 1711 22nd Ave NE
- 823 20th Ave NE
- 2406 Fillmore St NE
- 1115 24th Ave NE
- 2410 Fillmore St NE
- 2338 Fillmore St NE
- 1120 24th Ave NE
- 2414 Fillmore St NE
- 1111 24th Ave NE
- 1114 24th Ave NE
- 1114 1114 24th-Avenue-ne
- 2332 Fillmore St NE
- 2401 Fillmore St NE
- 2418 Fillmore St NE
- 2403 Fillmore St NE
- 2321 Fillmore St NE
- 2407 Fillmore St NE
- 2407 Fillmore St NE Unit 1
- 1107 24th Ave NE
- 1112 24th Ave NE
- 2411 Fillmore Street Northeast Lower
- 2319 Fillmore St NE