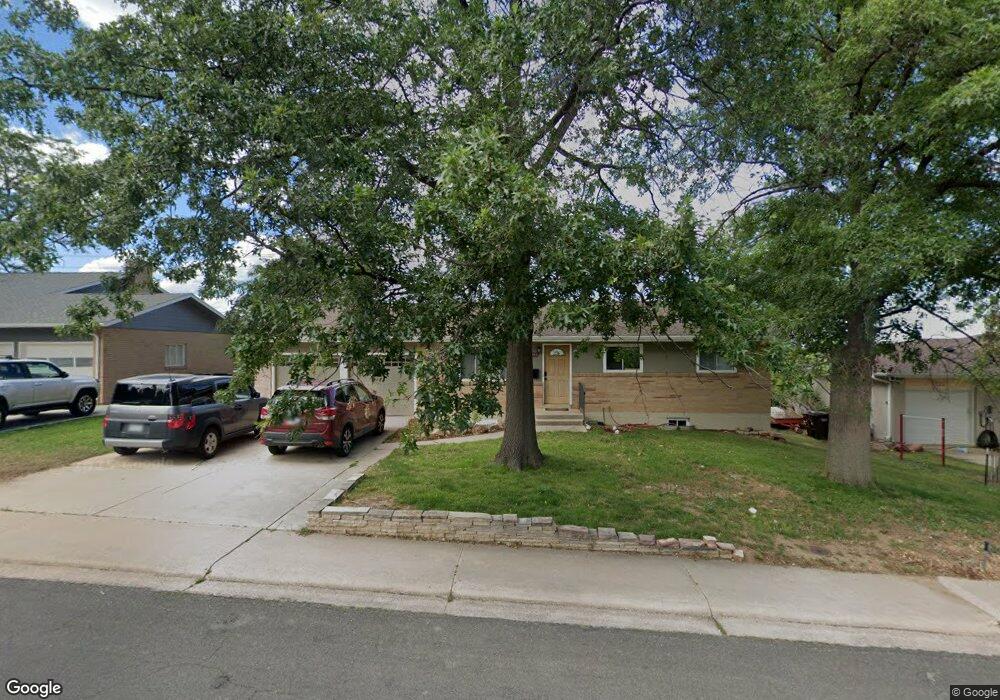
2405 Dartmouth Ave Boulder, CO 80305
South Boulder NeighborhoodEstimated Value: $1,010,187 - $1,406,000
3
Beds
3
Baths
1,026
Sq Ft
$1,119/Sq Ft
Est. Value
About This Home
This home is located at 2405 Dartmouth Ave, Boulder, CO 80305 and is currently estimated at $1,148,547, approximately $1,119 per square foot. 2405 Dartmouth Ave is a home located in Boulder County with nearby schools including Creekside Elementary School, Bear Creek Elementary School, and Southern Hills Middle School.
Ownership History
Date
Name
Owned For
Owner Type
Purchase Details
Closed on
Jul 23, 2009
Sold by
Shea Catherine A
Bought by
Su Steven
Current Estimated Value
Home Financials for this Owner
Home Financials are based on the most recent Mortgage that was taken out on this home.
Original Mortgage
$320,000
Outstanding Balance
$213,056
Interest Rate
5.71%
Mortgage Type
Purchase Money Mortgage
Estimated Equity
$935,491
Purchase Details
Closed on
Sep 1, 2000
Sold by
Vance Beverly Ann and Vance Lillie A
Bought by
Shea Catherine A
Home Financials for this Owner
Home Financials are based on the most recent Mortgage that was taken out on this home.
Original Mortgage
$260,000
Interest Rate
8.16%
Purchase Details
Closed on
Jul 29, 1999
Sold by
Sowell Lillie A
Bought by
Vance Beverly Ann
Purchase Details
Closed on
Jul 16, 1985
Bought by
Su Steven
Create a Home Valuation Report for This Property
The Home Valuation Report is an in-depth analysis detailing your home's value as well as a comparison with similar homes in the area
Home Values in the Area
Average Home Value in this Area
Purchase History
| Date | Buyer | Sale Price | Title Company |
|---|---|---|---|
| Su Steven | $400,000 | Htco | |
| Shea Catherine A | $325,000 | -- | |
| Vance Beverly Ann | -- | -- | |
| Su Steven | -- | -- |
Source: Public Records
Mortgage History
| Date | Status | Borrower | Loan Amount |
|---|---|---|---|
| Open | Su Steven | $320,000 | |
| Previous Owner | Shea Catherine A | $260,000 |
Source: Public Records
Tax History Compared to Growth
Tax History
| Year | Tax Paid | Tax Assessment Tax Assessment Total Assessment is a certain percentage of the fair market value that is determined by local assessors to be the total taxable value of land and additions on the property. | Land | Improvement |
|---|---|---|---|---|
| 2025 | $5,491 | $65,007 | $56,413 | $8,594 |
| 2024 | $5,491 | $65,007 | $56,413 | $8,594 |
| 2023 | $5,396 | $62,478 | $59,546 | $6,616 |
| 2022 | $4,822 | $51,923 | $46,731 | $5,192 |
| 2021 | $4,598 | $53,418 | $48,076 | $5,342 |
| 2020 | $4,668 | $53,632 | $42,900 | $10,732 |
| 2019 | $4,597 | $53,632 | $42,900 | $10,732 |
| 2018 | $4,430 | $51,091 | $32,112 | $18,979 |
| 2017 | $4,291 | $56,485 | $35,502 | $20,983 |
| 2016 | $3,784 | $43,717 | $25,313 | $18,404 |
| 2015 | $3,584 | $33,774 | $13,771 | $20,003 |
| 2014 | $2,840 | $33,774 | $13,771 | $20,003 |
Source: Public Records
Map
Nearby Homes
- 2585 Kohler Dr
- 2235 Vassar Dr
- 2100 Kohler Dr
- 2490 Vassar Dr
- 140 S Lashley Ln
- 2955 Stanford Ave
- 1965 Kohler Dr
- 1865 Kohler Dr
- 245 Fair Place
- 325 27th St
- 2250 Bluebell Ave
- 419 22nd St
- 3410 Ash Ave
- 2003 Bluebell Ave
- 385 32nd St
- 2119 Mariposa Ave
- 2860 Table Mesa Dr
- 2030 Columbine Ave
- 2877 Moorhead Ave
- 45 Bellevue Dr
- 2395 Dartmouth Ave
- 2445 Dartmouth Ave
- 2400 Dartmouth Ave
- 2365 Dartmouth Ave
- 2420 Dartmouth Ave
- 2390 Dartmouth Ave
- 2440 Dartmouth Ave
- 2465 Dartmouth Ave
- 2335 Dartmouth Ave
- 2360 Dartmouth Ave
- 2425 Kenwood Dr
- 2455 Kenwood Dr
- 2460 Dartmouth Ave
- 2485 Dartmouth Ave
- 2475 Kenwood Dr
- 2405 Kenwood Dr
- 2330 Dartmouth Ave
- 2305 Dartmouth Ave
- 2500 Dartmouth Ave
- 2495 Kenwood Dr