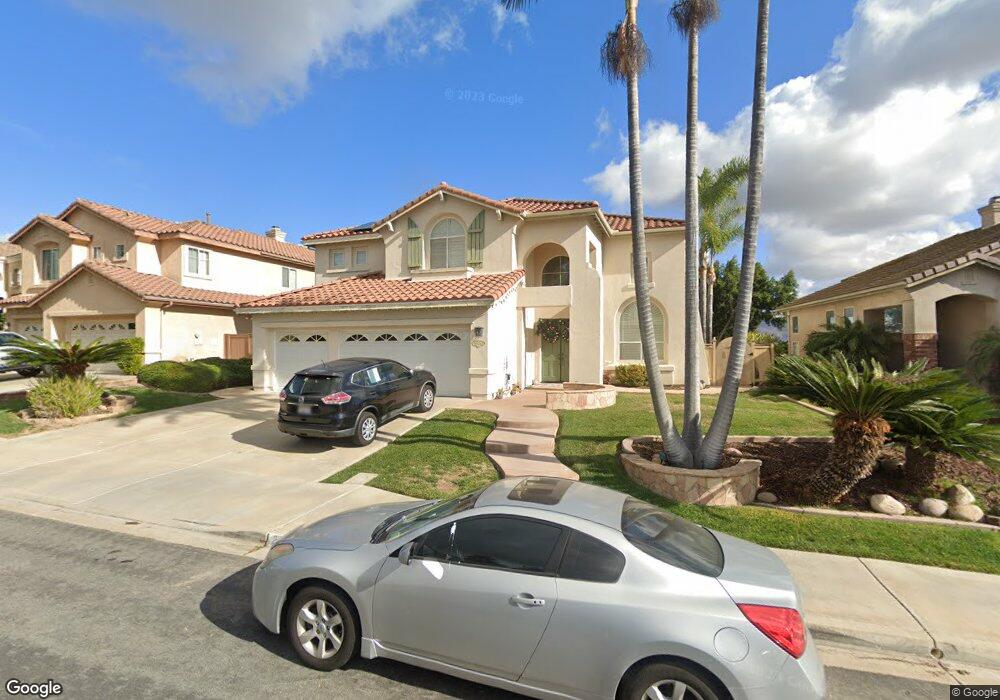
2405 Green River Dr Chula Vista, CA 91915
Eastlake NeighborhoodEstimated Value: $1,101,794 - $1,255,000
5
Beds
4
Baths
2,846
Sq Ft
$413/Sq Ft
Est. Value
About This Home
This home is located at 2405 Green River Dr, Chula Vista, CA 91915 and is currently estimated at $1,174,949, approximately $412 per square foot. 2405 Green River Dr is a home located in San Diego County with nearby schools including Olympic View Elementary School, Eastlake Middle School, and Eastlake High School.
Ownership History
Date
Name
Owned For
Owner Type
Purchase Details
Closed on
Nov 7, 2019
Sold by
Church Teresa and Church Teresa De Jesus
Bought by
Church Teresa and Theresa De Jesus Church Trust
Current Estimated Value
Purchase Details
Closed on
Feb 17, 2012
Sold by
Church Donald Eugene
Bought by
Church Teresa De Jesus
Home Financials for this Owner
Home Financials are based on the most recent Mortgage that was taken out on this home.
Original Mortgage
$288,000
Outstanding Balance
$196,836
Interest Rate
3.84%
Mortgage Type
New Conventional
Estimated Equity
$978,113
Purchase Details
Closed on
Dec 15, 1997
Sold by
Ridgewood Llc
Bought by
Church Donald Eugene and Church Teresa Dejesus
Home Financials for this Owner
Home Financials are based on the most recent Mortgage that was taken out on this home.
Original Mortgage
$226,950
Interest Rate
7.05%
Create a Home Valuation Report for This Property
The Home Valuation Report is an in-depth analysis detailing your home's value as well as a comparison with similar homes in the area
Home Values in the Area
Average Home Value in this Area
Purchase History
| Date | Buyer | Sale Price | Title Company |
|---|---|---|---|
| Church Teresa | -- | None Available | |
| Church Teresa De Jesus | -- | Lawyers Title | |
| Church Donald Eugene | $306,000 | Chicago Title Co |
Source: Public Records
Mortgage History
| Date | Status | Borrower | Loan Amount |
|---|---|---|---|
| Open | Church Teresa De Jesus | $288,000 | |
| Previous Owner | Church Donald Eugene | $226,950 |
Source: Public Records
Tax History Compared to Growth
Tax History
| Year | Tax Paid | Tax Assessment Tax Assessment Total Assessment is a certain percentage of the fair market value that is determined by local assessors to be the total taxable value of land and additions on the property. | Land | Improvement |
|---|---|---|---|---|
| 2025 | $5,505 | $487,949 | $143,697 | $344,252 |
| 2024 | $5,505 | $478,382 | $140,880 | $337,502 |
| 2023 | $5,413 | $469,003 | $138,118 | $330,885 |
| 2022 | $6,766 | $459,808 | $135,410 | $324,398 |
| 2021 | $6,606 | $450,793 | $132,755 | $318,038 |
| 2020 | $6,445 | $446,171 | $131,394 | $314,777 |
| 2019 | $6,279 | $437,423 | $128,818 | $308,605 |
| 2018 | $6,167 | $428,847 | $126,293 | $302,554 |
| 2017 | $12 | $420,439 | $123,817 | $296,622 |
| 2016 | $6,087 | $412,196 | $121,390 | $290,806 |
| 2015 | $6,010 | $406,005 | $119,567 | $286,438 |
| 2014 | $6,411 | $398,053 | $117,225 | $280,828 |
Source: Public Records
Map
Nearby Homes
- 2408 Green River Dr
- 1220 Silverado Dr
- 1215 Pinehurst Rd
- 2088 Bravo Loop
- 2065 Bravo Loop Unit 6
- 1246 Boca Raton Dr
- 2181 Caminito Norina Unit 134
- 1446 Caminito Sardinia
- 1445 Caminito Sicilia
- 1338 Caminito Fabrizio Unit 72
- 0 Towncenter Lot#4
- 2300 Palomira Ct
- 2235 Old Barn Ln
- 1452 S Creekside Dr
- 1603 Quiet Trail Dr
- 1277 Granite Springs Dr
- 2166 Nopalito Dr Unit 70
- 1624 Filaree Dr Unit 155
- 1623 Gila Ct Unit 177
- 1623 Gila Ct Unit 175
- 2409 Green River Dr
- 2401 Green River Dr
- 2413 Green River Dr Unit 6
- 2397 Green River Dr
- 2404 Green River Dr
- 2400 Green River Dr
- 2393 Green River Dr
- 2412 Green River Dr
- 2396 Green River Dr
- 2416 Green River Dr
- 2389 Green River Dr
- 2394 Green River Dr
- 1371 S Hills Dr
- 1375 S Hills Dr
- 1367 S Hills Dr
- 1324 Silverado Dr
- 1379 S Hills Dr
- 1363 S Hills Dr
- 2390 Green River Dr
- 1381 S Hills Dr