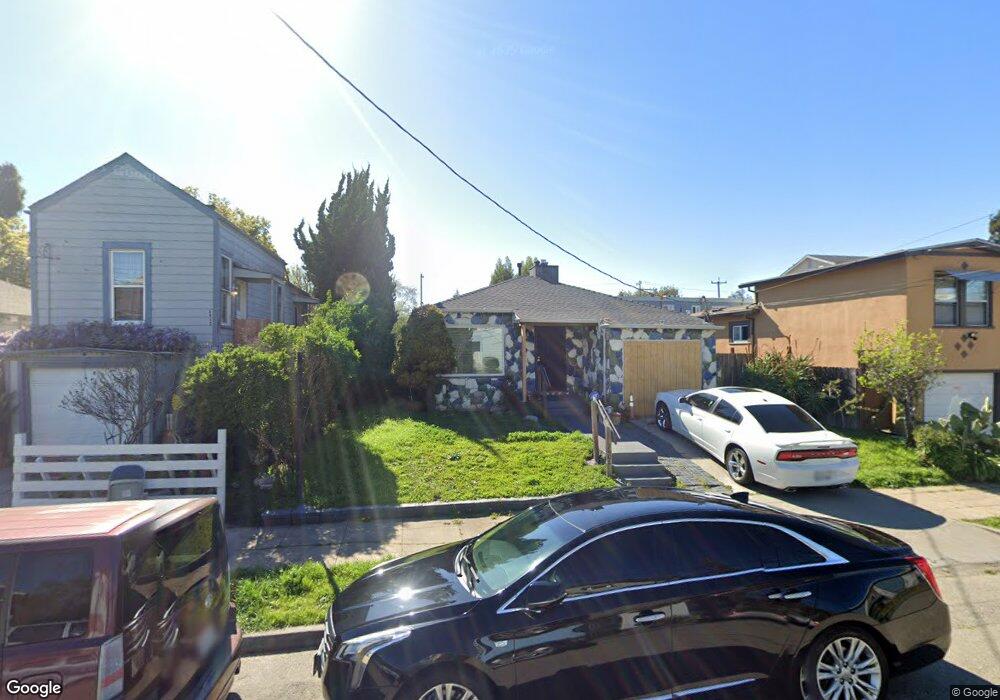
2408 7th St Berkeley, CA 94710
West Berkeley NeighborhoodEstimated Value: $773,000 - $1,159,000
4
Beds
2
Baths
1,632
Sq Ft
$615/Sq Ft
Est. Value
About This Home
This home is located at 2408 7th St, Berkeley, CA 94710 and is currently estimated at $1,003,754, approximately $615 per square foot. 2408 7th St is a home located in Alameda County with nearby schools including Rosa Parks Elementary School, Ruth Acty Elementary, and Berkeley Arts Magnet at Whittier School.
Ownership History
Date
Name
Owned For
Owner Type
Purchase Details
Closed on
May 31, 2016
Sold by
Williams Eleanor and The Corinne M Carroll Revocabl
Bought by
Carroll Valcour and Ford Phyllis
Current Estimated Value
Purchase Details
Closed on
Dec 21, 2015
Sold by
Ford Phlllis and Corinne M Carrill Revocable Tr
Bought by
Carroll Valcour and Ford Phyllis
Purchase Details
Closed on
Jun 21, 2000
Sold by
Carroll Corinne M
Bought by
Carroll Corinne M and Corinne M Carroll Revocable Li
Create a Home Valuation Report for This Property
The Home Valuation Report is an in-depth analysis detailing your home's value as well as a comparison with similar homes in the area
Home Values in the Area
Average Home Value in this Area
Purchase History
| Date | Buyer | Sale Price | Title Company |
|---|---|---|---|
| Carroll Valcour | -- | None Available | |
| Carroll Valcour | -- | None Available | |
| Carroll Corinne M | -- | -- |
Source: Public Records
Tax History
| Year | Tax Paid | Tax Assessment Tax Assessment Total Assessment is a certain percentage of the fair market value that is determined by local assessors to be the total taxable value of land and additions on the property. | Land | Improvement |
|---|---|---|---|---|
| 2025 | $4,492 | $53,068 | $13,239 | $46,829 |
| 2024 | $4,492 | $51,891 | $12,980 | $45,911 |
| 2023 | $4,313 | $57,735 | $12,725 | $45,010 |
| 2022 | $4,325 | $49,604 | $12,476 | $44,128 |
| 2021 | $4,286 | $48,494 | $12,231 | $43,263 |
| 2020 | $3,969 | $54,925 | $12,106 | $42,819 |
| 2019 | $3,711 | $53,848 | $11,868 | $41,980 |
| 2018 | $3,653 | $52,793 | $11,636 | $41,157 |
| 2017 | $3,494 | $51,757 | $11,407 | $40,350 |
| 2016 | $8,940 | $516,867 | $237,038 | $279,829 |
| 2015 | $3,107 | $49,980 | $11,016 | $38,964 |
| 2014 | $2,972 | $49,001 | $10,800 | $38,201 |
Source: Public Records
Map
Nearby Homes
- 2238 7th St
- 931 Bancroft Way
- 2220 7th St
- 2241 Ninth St
- 1050 Allston Way
- 2327 10th St Unit 4
- 2512 9th St Unit 10
- 1039 Channing Way
- 1092 Dwight Way
- 1013 Addison St
- 1118 Dwight Way
- 2013 9th St
- 1142 Dwight Way
- 2324 Browning St
- 2144 Curtis St
- 1034 Grayson St
- 940 Delaware St
- 817 Delaware St
- 2747 San Pablo Ave Unit 507
- 1919 Curtis St
Your Personal Tour Guide
Ask me questions while you tour the home.