2409 N Pine St Wilmington, DE 19802
Vandever Avenue NeighborhoodEstimated Value: $124,991 - $193,000
3
Beds
1
Bath
1,160
Sq Ft
$131/Sq Ft
Est. Value
About This Home
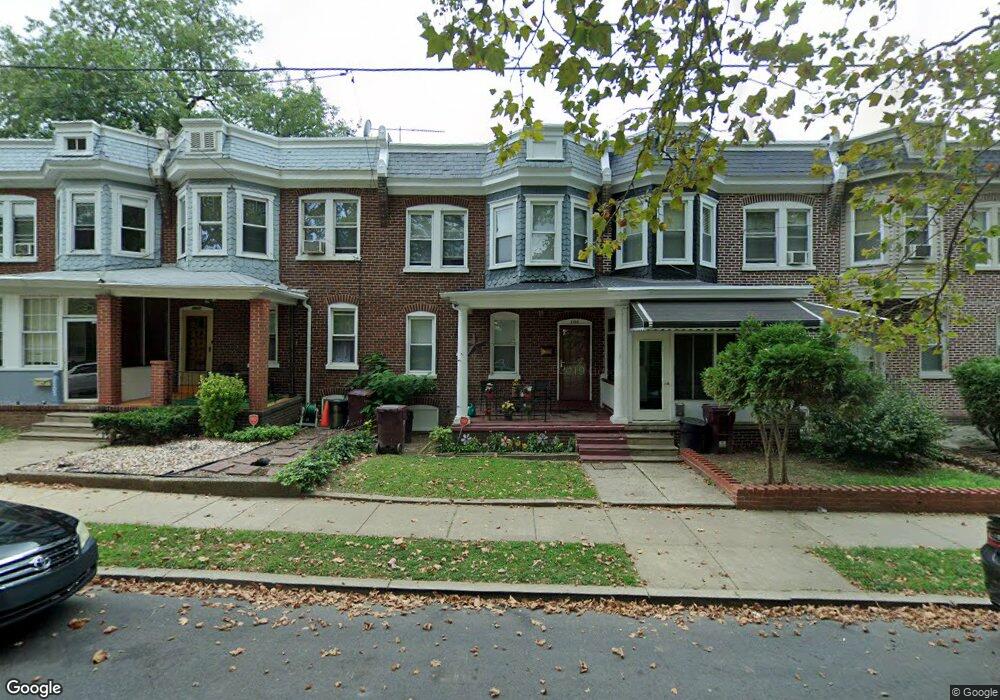
This home is located at 2409 N Pine St, Wilmington, DE 19802 and is currently estimated at $151,748, approximately $130 per square foot. 2409 N Pine St is a home located in New Castle County with nearby schools including Hanby Elementary School, Springer Middle School, and Mount Pleasant High School.
Ownership History
Date
Name
Owned For
Owner Type
Purchase Details
Closed on
Nov 29, 2001
Sold by
Sgm Group Inc
Bought by
Robinson Vandrick Farlane
Current Estimated Value
Home Financials for this Owner
Home Financials are based on the most recent Mortgage that was taken out on this home.
Original Mortgage
$84,250
Outstanding Balance
$33,141
Interest Rate
6.66%
Mortgage Type
FHA
Estimated Equity
$118,607
Purchase Details
Closed on
Nov 7, 2001
Sold by
Abbar Investment Inc
Bought by
Sgm Group Inc
Home Financials for this Owner
Home Financials are based on the most recent Mortgage that was taken out on this home.
Original Mortgage
$84,250
Outstanding Balance
$33,141
Interest Rate
6.66%
Mortgage Type
FHA
Estimated Equity
$118,607
Create a Home Valuation Report for This Property
The Home Valuation Report is an in-depth analysis detailing your home's value as well as a comparison with similar homes in the area
Home Values in the Area
Average Home Value in this Area
Purchase History
| Date | Buyer | Sale Price | Title Company |
|---|---|---|---|
| Robinson Vandrick Farlane | -- | -- | |
| Sgm Group Inc | $38,000 | -- |
Source: Public Records
Mortgage History
| Date | Status | Borrower | Loan Amount |
|---|---|---|---|
| Open | Robinson Vandrick Farlane | $84,250 |
Source: Public Records
Tax History Compared to Growth
Tax History
| Year | Tax Paid | Tax Assessment Tax Assessment Total Assessment is a certain percentage of the fair market value that is determined by local assessors to be the total taxable value of land and additions on the property. | Land | Improvement |
|---|---|---|---|---|
| 2024 | $636 | $19,700 | $2,600 | $17,100 |
| 2023 | $578 | $19,700 | $2,600 | $17,100 |
| 2022 | $584 | $19,700 | $2,600 | $17,100 |
| 2021 | $583 | $19,700 | $2,600 | $17,100 |
| 2020 | $584 | $19,700 | $2,600 | $17,100 |
| 2019 | $980 | $19,700 | $2,600 | $17,100 |
| 2018 | $565 | $19,700 | $2,600 | $17,100 |
| 2017 | $561 | $19,700 | $2,600 | $17,100 |
| 2016 | $561 | $19,700 | $2,600 | $17,100 |
| 2015 | $874 | $19,700 | $2,600 | $17,100 |
| 2014 | $874 | $19,700 | $2,600 | $17,100 |
Source: Public Records
Map
Nearby Homes