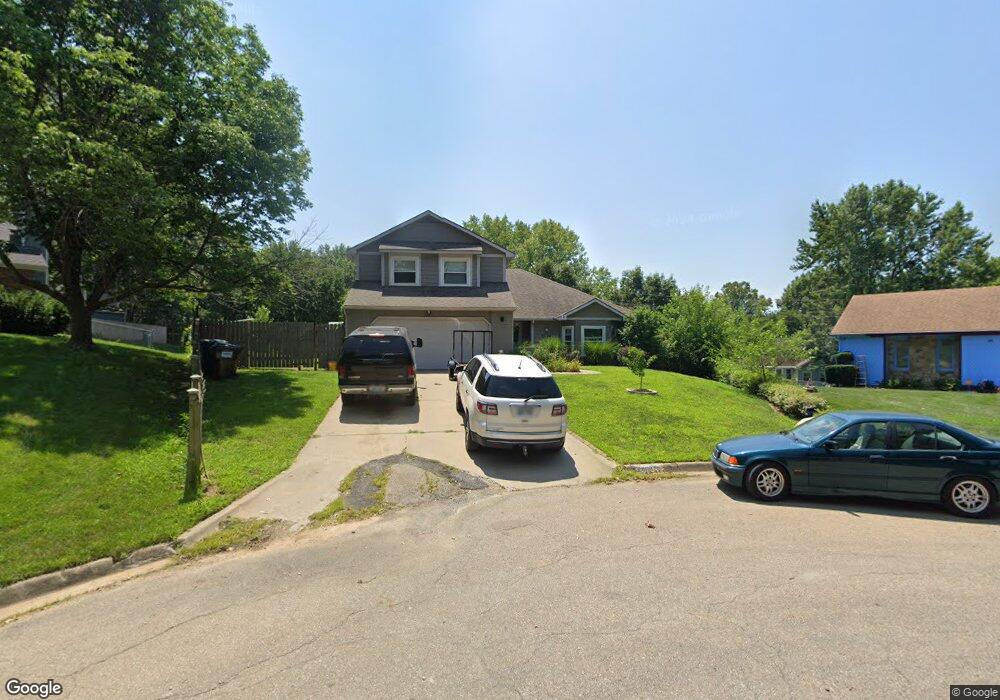
2409 Winterbrook Ct Lawrence, KS 66047
Estimated Value: $303,000 - $325,168
3
Beds
3
Baths
2,019
Sq Ft
$155/Sq Ft
Est. Value
About This Home
This home is located at 2409 Winterbrook Ct, Lawrence, KS 66047 and is currently estimated at $312,292, approximately $154 per square foot. 2409 Winterbrook Ct is a home located in Douglas County with nearby schools including Sunflower Elementary School, Southwest Middle School, and Lawrence High School.
Ownership History
Date
Name
Owned For
Owner Type
Purchase Details
Closed on
Jan 8, 2021
Sold by
Midwest Investing Llc
Bought by
Macasio Anthony and Macasio Caitlyn
Current Estimated Value
Home Financials for this Owner
Home Financials are based on the most recent Mortgage that was taken out on this home.
Original Mortgage
$228,000
Outstanding Balance
$203,491
Interest Rate
2.71%
Mortgage Type
New Conventional
Estimated Equity
$108,801
Purchase Details
Closed on
Jun 16, 2020
Sold by
Mohabbat Mohammad Haroon and Mohabbat Khatol
Bought by
Midwest Investing Llc
Home Financials for this Owner
Home Financials are based on the most recent Mortgage that was taken out on this home.
Original Mortgage
$185,400
Interest Rate
3%
Mortgage Type
Future Advance Clause Open End Mortgage
Purchase Details
Closed on
Jul 16, 2004
Sold by
Mohabbat Alishah and Mohabbat Zainab
Bought by
Mohabbat Mohammad Haroon and Mohabbat Khatol
Create a Home Valuation Report for This Property
The Home Valuation Report is an in-depth analysis detailing your home's value as well as a comparison with similar homes in the area
Purchase History
| Date | Buyer | Sale Price | Title Company |
|---|---|---|---|
| Macasio Anthony | -- | Security 1St Title | |
| Midwest Investing Llc | -- | Security 1St Title | |
| Mohabbat Mohammad Haroon | -- | First American Title |
Source: Public Records
Mortgage History
| Date | Status | Borrower | Loan Amount |
|---|---|---|---|
| Open | Macasio Anthony | $228,000 | |
| Previous Owner | Midwest Investing Llc | $185,400 |
Source: Public Records
Tax History
| Year | Tax Paid | Tax Assessment Tax Assessment Total Assessment is a certain percentage of the fair market value that is determined by local assessors to be the total taxable value of land and additions on the property. | Land | Improvement |
|---|---|---|---|---|
| 2025 | $4,060 | $33,005 | $7,475 | $25,530 |
| 2024 | $4,061 | $32,995 | $5,750 | $27,245 |
| 2023 | $4,077 | $31,832 | $5,520 | $26,312 |
| 2022 | $3,978 | $30,832 | $5,060 | $25,772 |
| 2021 | $3,650 | $27,370 | $4,830 | $22,540 |
| 2020 | $2,910 | $22,000 | $4,830 | $17,170 |
| 2019 | $2,776 | $21,022 | $4,830 | $16,192 |
| 2018 | $2,702 | $20,321 | $4,600 | $15,721 |
| 2017 | $2,506 | $18,665 | $4,600 | $14,065 |
| 2016 | $2,338 | $18,205 | $4,022 | $14,183 |
| 2015 | $2,182 | $17,009 | $4,022 | $12,987 |
| 2014 | $2,161 | $17,009 | $4,022 | $12,987 |
Source: Public Records
Map
Nearby Homes
- 3621 Brush Creek Dr
- 2235 Vail Way
- 2920 Chisholm Dr
- 4142 Blackjack Oak Dr
- 2013 Camelback Dr
- 2018 Crossgate Dr
- 2726 Coralberry Ct
- 2709 Lawrence Ave
- 2713 W 24th Terrace
- 2005 Atchison Ave
- 3700 Quail Creek Ct
- 2904 Atchison Cir
- 2002 Quail Creek Dr
- 2009 Crossgate Dr
- 1840 Quail Creek Dr
- 2615 Red Cedar Dr
- 2729 Pebble Ln
- 4206 Teal Dr
- 1908 Crossgate Dr
- 1807 Meadowlark Ln
- 2408 Winterbrook Ct
- 2413 Winterbrook Ct
- 3428 Lazy Brook Ln
- 3440 Lazy Brook Ln
- 3416 W 24th Place
- 2404 Winterbrook Ct
- 2417 Winterbrook Ct
- 3422 Lazy Brook Ln
- 3446 Lazy Brook Ln
- 3410 W 24th Place
- 2401 Winterbrook Ct
- 2400 Winterbrook Ct
- 2408 Brush Creek Dr
- 3416 Lazy Brook Ln
- 3409 W 24th Place
- 2414 Brush Creek Dr
- 3409 Lazy Brook Ln
- 3411 Lazy Brook Ln
- 3413 W 24th St
- 2409 Overlook Cir
Your Personal Tour Guide
Ask me questions while you tour the home.