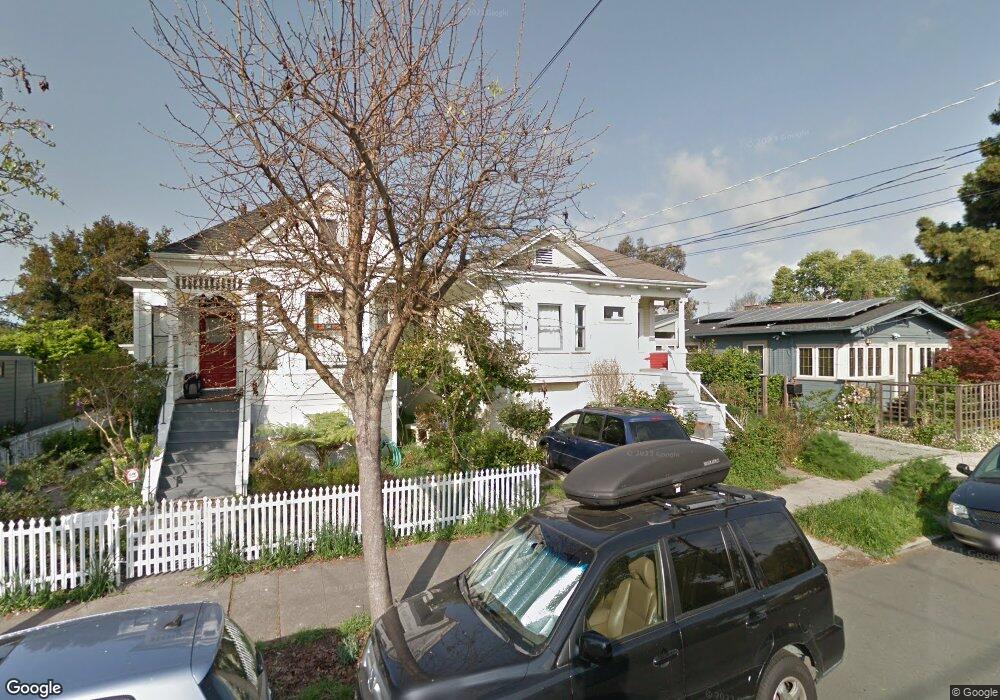
2416 10th St Berkeley, CA 94710
West Berkeley NeighborhoodEstimated Value: $797,000 - $1,030,430
3
Beds
1
Bath
1,037
Sq Ft
$904/Sq Ft
Est. Value
About This Home
This home is located at 2416 10th St, Berkeley, CA 94710 and is currently estimated at $937,858, approximately $904 per square foot. 2416 10th St is a home located in Alameda County with nearby schools including Rosa Parks Elementary School, Ruth Acty Elementary, and Berkeley Arts Magnet at Whittier School.
Ownership History
Date
Name
Owned For
Owner Type
Purchase Details
Closed on
May 22, 2009
Sold by
Hebert Andre C and Nelson Brooke Ella
Bought by
Hebert Andre C and Nelson Brooke Ella
Current Estimated Value
Home Financials for this Owner
Home Financials are based on the most recent Mortgage that was taken out on this home.
Original Mortgage
$196,000
Outstanding Balance
$123,504
Interest Rate
4.8%
Mortgage Type
New Conventional
Estimated Equity
$814,354
Purchase Details
Closed on
Mar 25, 1999
Sold by
Werner Edward C and Werner Kenneth R
Bought by
Herbert Andre C and Nelson Brooke Ella
Home Financials for this Owner
Home Financials are based on the most recent Mortgage that was taken out on this home.
Original Mortgage
$192,000
Interest Rate
6.79%
Mortgage Type
Stand Alone First
Purchase Details
Closed on
Oct 23, 1996
Sold by
Werner Edith O
Bought by
Wernr Edward C and Werner Kenneth R
Create a Home Valuation Report for This Property
The Home Valuation Report is an in-depth analysis detailing your home's value as well as a comparison with similar homes in the area
Home Values in the Area
Average Home Value in this Area
Purchase History
| Date | Buyer | Sale Price | Title Company |
|---|---|---|---|
| Hebert Andre C | -- | Chicago Title Company | |
| Herbert Andre C | $252,000 | Placer Title Company | |
| Werner Kenneth R | -- | Placer Title Company | |
| Werner Edward C | -- | Placer Title Company | |
| Wernr Edward C | -- | -- |
Source: Public Records
Mortgage History
| Date | Status | Borrower | Loan Amount |
|---|---|---|---|
| Open | Hebert Andre C | $196,000 | |
| Previous Owner | Herbert Andre C | $192,000 |
Source: Public Records
Tax History
| Year | Tax Paid | Tax Assessment Tax Assessment Total Assessment is a certain percentage of the fair market value that is determined by local assessors to be the total taxable value of land and additions on the property. | Land | Improvement |
|---|---|---|---|---|
| 2025 | $8,270 | $395,040 | $118,512 | $276,528 |
| 2024 | $8,270 | $387,295 | $116,188 | $271,107 |
| 2023 | $8,076 | $379,703 | $113,911 | $265,792 |
| 2022 | $7,878 | $372,258 | $111,677 | $260,581 |
| 2021 | $7,873 | $364,961 | $109,488 | $255,473 |
| 2020 | $7,313 | $361,218 | $108,365 | $252,853 |
| 2019 | $6,877 | $354,137 | $106,241 | $247,896 |
| 2018 | $6,722 | $347,194 | $104,158 | $243,036 |
| 2017 | $6,476 | $340,388 | $102,116 | $238,272 |
| 2016 | $6,168 | $333,715 | $100,114 | $233,601 |
| 2015 | $6,072 | $328,703 | $98,611 | $230,092 |
| 2014 | $5,992 | $322,264 | $96,679 | $225,585 |
Source: Public Records
Map
Nearby Homes
- 1039 Channing Way
- 2327 10th St Unit 4
- 2512 9th St Unit 10
- 1118 Dwight Way
- 2241 Ninth St
- 2324 Browning St
- 931 Bancroft Way
- 2238 7th St
- 2220 7th St
- 2144 Curtis St
- 1050 Allston Way
- 1013 Addison St
- 1034 Grayson St
- 2747 San Pablo Ave Unit 507
- 2013 9th St
- 2010 9th St
- 2751 Wallace St
- 1919 Curtis St
- 1450 Ward St
- 1515 Derby St
Your Personal Tour Guide
Ask me questions while you tour the home.