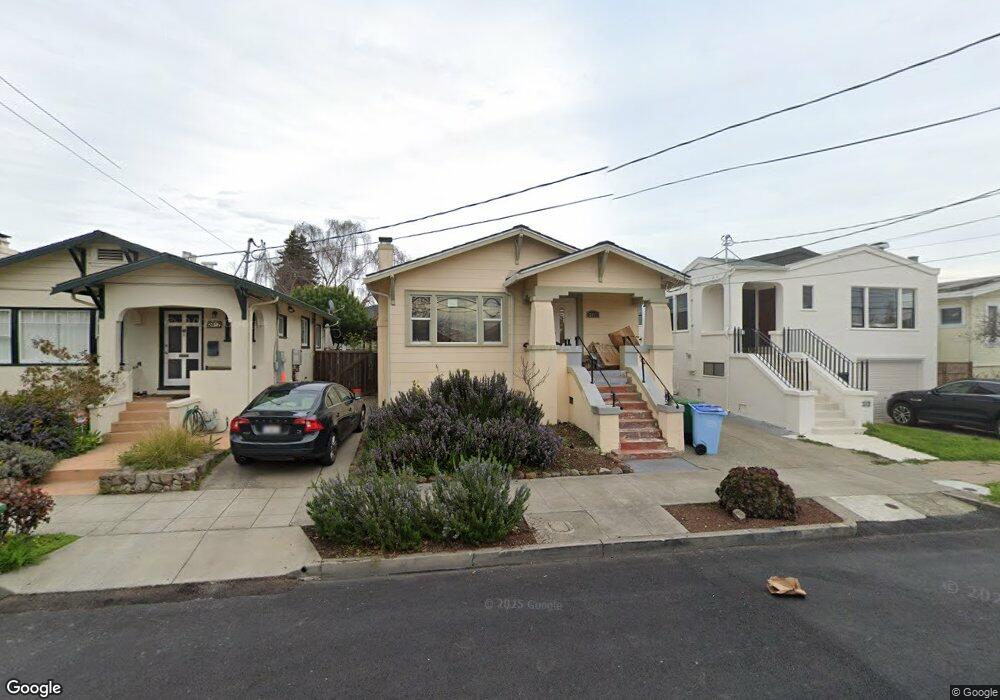
2419 Acton St Berkeley, CA 94702
West Berkeley NeighborhoodEstimated Value: $1,363,000 - $1,479,000
2
Beds
1
Bath
1,377
Sq Ft
$1,015/Sq Ft
Est. Value
About This Home
This home is located at 2419 Acton St, Berkeley, CA 94702 and is currently estimated at $1,397,523, approximately $1,014 per square foot. 2419 Acton St is a home located in Alameda County with nearby schools including Washington Elementary School, Oxford Elementary School, and Malcolm X Elementary School.
Ownership History
Date
Name
Owned For
Owner Type
Purchase Details
Closed on
May 12, 2016
Sold by
Grady Cheryl K
Bought by
Grady Cheryl K
Current Estimated Value
Purchase Details
Closed on
Apr 14, 2004
Sold by
Grady Cheryl and Robinson Frederick
Bought by
Grady Cheryl K
Home Financials for this Owner
Home Financials are based on the most recent Mortgage that was taken out on this home.
Original Mortgage
$272,576
Interest Rate
5.38%
Mortgage Type
Stand Alone First
Create a Home Valuation Report for This Property
The Home Valuation Report is an in-depth analysis detailing your home's value as well as a comparison with similar homes in the area
Home Values in the Area
Average Home Value in this Area
Purchase History
| Date | Buyer | Sale Price | Title Company |
|---|---|---|---|
| Grady Cheryl K | -- | None Available | |
| Grady Cheryl K | $285,000 | Fidelity National Title Co | |
| Grady Cheryl K | -- | Fidelity National Title Co |
Source: Public Records
Mortgage History
| Date | Status | Borrower | Loan Amount |
|---|---|---|---|
| Closed | Grady Cheryl K | $272,576 |
Source: Public Records
Tax History
| Year | Tax Paid | Tax Assessment Tax Assessment Total Assessment is a certain percentage of the fair market value that is determined by local assessors to be the total taxable value of land and additions on the property. | Land | Improvement |
|---|---|---|---|---|
| 2025 | $15,731 | $1,116,749 | $435,210 | $681,539 |
| 2024 | $15,731 | $1,094,857 | $426,678 | $668,179 |
| 2023 | $15,421 | $1,073,389 | $418,312 | $655,077 |
| 2022 | $15,180 | $1,052,345 | $410,111 | $642,234 |
| 2021 | $15,218 | $1,031,714 | $402,071 | $629,643 |
| 2020 | $14,499 | $1,021,140 | $397,950 | $623,190 |
| 2019 | $13,831 | $988,380 | $390,150 | $598,230 |
| 2018 | $13,622 | $969,000 | $382,500 | $586,500 |
| 2017 | $13,154 | $950,000 | $375,000 | $575,000 |
| 2016 | $1,944 | $39,351 | $21,332 | $18,019 |
| 2015 | $1,904 | $38,760 | $21,012 | $17,748 |
| 2014 | $1,856 | $38,000 | $20,600 | $17,400 |
Source: Public Records
Map
Nearby Homes
- 2350 Sacramento St
- 2324 Browning St
- 1645 Dwight Way
- 1612 Parker St
- 1142 Dwight Way
- 1515 Derby St
- 1118 Dwight Way
- 1612 Carleton St
- 2231 Byron St
- 2750 Sacramento St
- 2118 California St
- 1450 Ward St
- 2758 Sacramento St
- 2774 Sacramento St
- 2144 Curtis St
- 2782 Sacramento St
- 1092 Dwight Way
- 1039 Channing Way
- 2790 Sacramento St
- 2327 10th St Unit 4
Your Personal Tour Guide
Ask me questions while you tour the home.