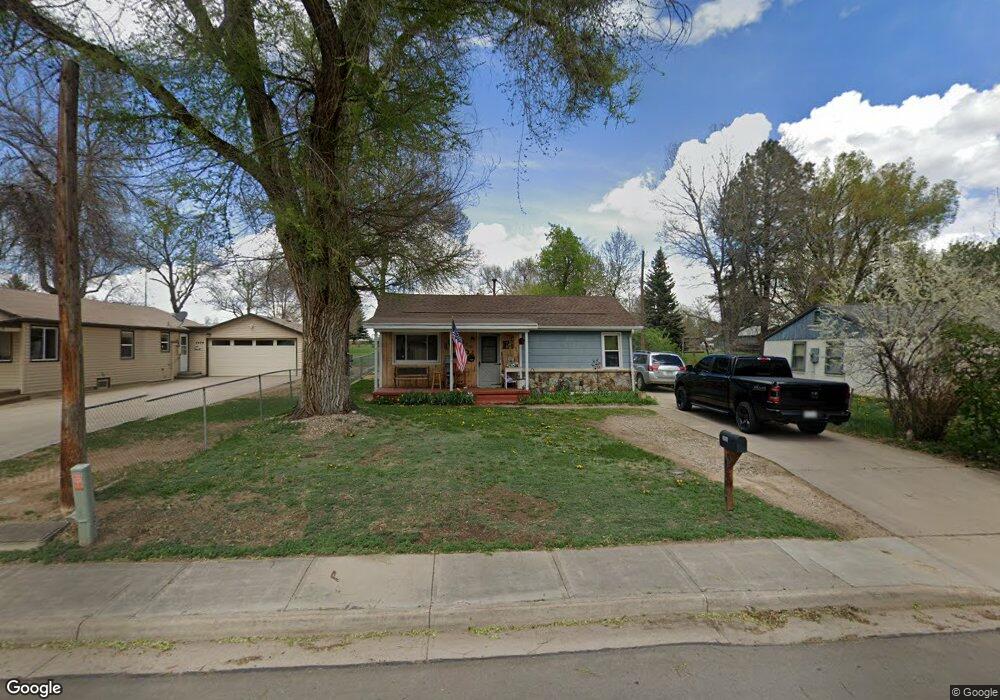
2420 W Mulberry St Fort Collins, CO 80521
Estimated Value: $402,000 - $417,000
2
Beds
1
Bath
808
Sq Ft
$504/Sq Ft
Est. Value
About This Home
This home is located at 2420 W Mulberry St, Fort Collins, CO 80521 and is currently estimated at $407,601, approximately $504 per square foot. 2420 W Mulberry St is a home located in Larimer County with nearby schools including Irish Elementary School, Lincoln Middle School, and Poudre High School.
Ownership History
Date
Name
Owned For
Owner Type
Purchase Details
Closed on
Feb 24, 2012
Sold by
Eckert James E and Surdam Sandra D
Bought by
Eckert James E and Eckert Sandra D
Current Estimated Value
Purchase Details
Closed on
Feb 10, 2004
Sold by
Schroeder Ted and Kathleen Sue Schroeder F
Bought by
Surdam Sandra D and Eckert James E
Home Financials for this Owner
Home Financials are based on the most recent Mortgage that was taken out on this home.
Original Mortgage
$142,759
Outstanding Balance
$66,209
Interest Rate
5.67%
Mortgage Type
FHA
Estimated Equity
$341,392
Purchase Details
Closed on
Sep 8, 2002
Sold by
Schroeder Ted and Schroeder Kathleen S
Bought by
Ted & Kathleen Sue Schroeder Family Tr
Purchase Details
Closed on
Aug 26, 2002
Sold by
Schroeder Ted and Schroeder Kathleen Sue
Bought by
Schroeder Ted and Schroeder Kathleen Sue
Purchase Details
Closed on
Jun 1, 1976
Bought by
Schroeder Ted and Schroeder Kathleen S
Create a Home Valuation Report for This Property
The Home Valuation Report is an in-depth analysis detailing your home's value as well as a comparison with similar homes in the area
Home Values in the Area
Average Home Value in this Area
Purchase History
| Date | Buyer | Sale Price | Title Company |
|---|---|---|---|
| Eckert James E | -- | Heritage Title | |
| Surdam Sandra D | $145,000 | -- | |
| Ted & Kathleen Sue Schroeder Family Tr | -- | -- | |
| Schroeder Ted | -- | -- | |
| Schroeder Ted | $24,000 | -- |
Source: Public Records
Mortgage History
| Date | Status | Borrower | Loan Amount |
|---|---|---|---|
| Open | Surdam Sandra D | $142,759 |
Source: Public Records
Tax History Compared to Growth
Tax History
| Year | Tax Paid | Tax Assessment Tax Assessment Total Assessment is a certain percentage of the fair market value that is determined by local assessors to be the total taxable value of land and additions on the property. | Land | Improvement |
|---|---|---|---|---|
| 2025 | $2,311 | $27,772 | $1,273 | $26,499 |
| 2024 | $2,199 | $27,772 | $1,273 | $26,499 |
| 2022 | $2,092 | $22,157 | $1,321 | $20,836 |
| 2021 | $2,114 | $22,795 | $1,359 | $21,436 |
| 2020 | $1,926 | $20,585 | $1,359 | $19,226 |
| 2019 | $1,934 | $20,585 | $1,359 | $19,226 |
| 2018 | $1,383 | $15,170 | $1,368 | $13,802 |
| 2017 | $1,378 | $15,170 | $1,368 | $13,802 |
| 2016 | $1,076 | $11,788 | $1,512 | $10,276 |
| 2015 | $1,068 | $11,790 | $1,510 | $10,280 |
| 2014 | $901 | $9,880 | $1,510 | $8,370 |
Source: Public Records
Map
Nearby Homes
- 2519 Timber Ct
- 805 Gallup Rd
- 2211 W Mulberry St Unit 264
- 2211 W Mulberry St Unit 81
- 2211 W Mulberry St Unit 273
- 2211 W Mulberry St Unit 106
- 813 Timber Ln
- 2812 W Woodford Ave Unit 2810A
- 812 Gallup Rd
- 812 Rocky Rd
- 2809 Orchard Place
- 2942 Orchard Place
- 2913 Orchard Place
- 2815 Orchard Place
- 2914 Orchard Place
- 2895 Orchard Place
- 501 Locust Grove Dr
- 2908 W Olive St Unit 2908
- 2609 Bartlett Dr
- 638 Ebon Pica St
- 2416 W Mulberry St
- 2500 W Mulberry St
- 2417 W Mulberry St
- 2410 W Mulberry St
- 2506 Myrtle Ct
- 2504 W Mulberry St
- 500 Tyler St
- 2512 Myrtle Ct
- 2500 Myrtle Ct
- 2518 Myrtle Ct
- 506 Tyler St
- 2406 W Mulberry St
- 2524 Myrtle Ct
- 512 Tyler St
- 2510 W Mulberry St
- 2530 Myrtle Ct
- 2514 W Mulberry St
- 2501 Myrtle Ct
- 518 Tyler St
- 518R Tyler St