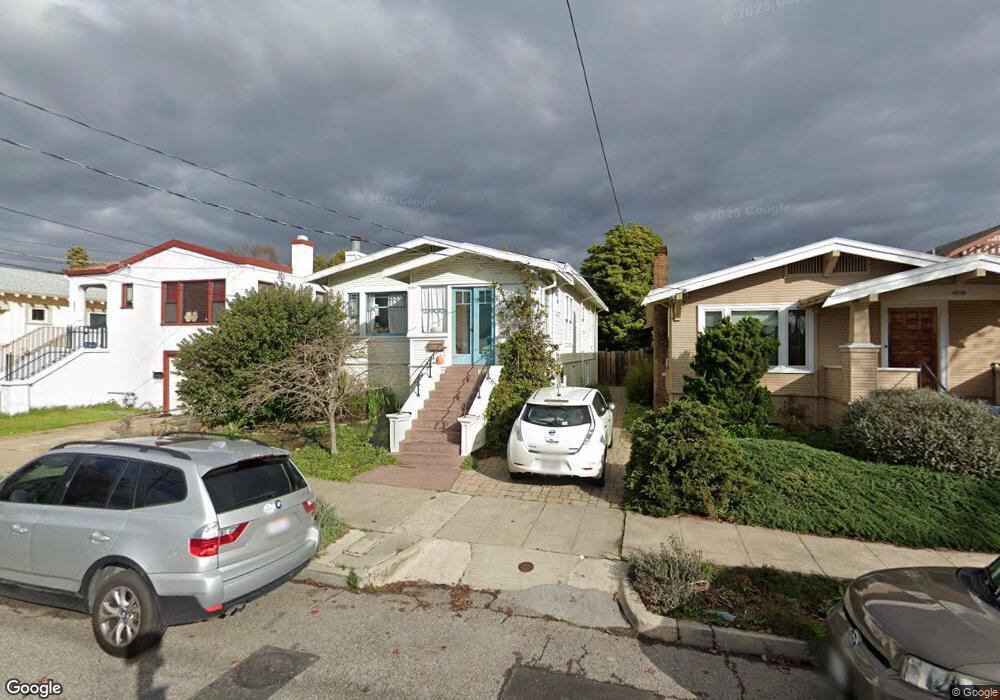
2425 Acton St Berkeley, CA 94702
West Berkeley NeighborhoodEstimated Value: $1,042,000 - $1,804,000
3
Beds
2
Baths
1,546
Sq Ft
$819/Sq Ft
Est. Value
About This Home
This home is located at 2425 Acton St, Berkeley, CA 94702 and is currently estimated at $1,266,707, approximately $819 per square foot. 2425 Acton St is a home located in Alameda County with nearby schools including Washington Elementary School, Oxford Elementary School, and Malcolm X Elementary School.
Ownership History
Date
Name
Owned For
Owner Type
Purchase Details
Closed on
Feb 19, 2016
Sold by
Smith Peter Jordan
Bought by
Smith Oseguera Living Trust
Current Estimated Value
Purchase Details
Closed on
Jul 15, 2004
Sold by
Kaminsky Norman Gabriala and Smith Peter Jordan
Bought by
Smith Peter Jordan
Home Financials for this Owner
Home Financials are based on the most recent Mortgage that was taken out on this home.
Original Mortgage
$181,136
Interest Rate
6.27%
Mortgage Type
Seller Take Back
Purchase Details
Closed on
Jul 17, 1997
Sold by
Dilts Barbara S and Hausken James P
Bought by
Smith P Jordan and Kaminsky Norma
Home Financials for this Owner
Home Financials are based on the most recent Mortgage that was taken out on this home.
Original Mortgage
$160,000
Interest Rate
7.7%
Purchase Details
Closed on
Apr 16, 1994
Sold by
Dilts Barbara S and Hausken James P
Bought by
Hausken James P and Dilts Barbara S
Create a Home Valuation Report for This Property
The Home Valuation Report is an in-depth analysis detailing your home's value as well as a comparison with similar homes in the area
Home Values in the Area
Average Home Value in this Area
Purchase History
| Date | Buyer | Sale Price | Title Company |
|---|---|---|---|
| Smith Oseguera Living Trust | -- | None Available | |
| Smith Peter Jordan | -- | -- | |
| Smith P Jordan | $200,000 | American Title Co | |
| Hausken James P | -- | -- |
Source: Public Records
Mortgage History
| Date | Status | Borrower | Loan Amount |
|---|---|---|---|
| Closed | Smith Peter Jordan | $181,136 | |
| Closed | Smith P Jordan | $160,000 |
Source: Public Records
Tax History
| Year | Tax Paid | Tax Assessment Tax Assessment Total Assessment is a certain percentage of the fair market value that is determined by local assessors to be the total taxable value of land and additions on the property. | Land | Improvement |
|---|---|---|---|---|
| 2025 | $8,468 | $405,294 | $95,800 | $316,494 |
| 2024 | $8,468 | $397,212 | $93,922 | $310,290 |
| 2023 | $8,216 | $396,287 | $92,080 | $304,207 |
| 2022 | $6,964 | $293,917 | $90,275 | $210,642 |
| 2021 | $6,113 | $288,017 | $88,505 | $206,512 |
| 2020 | $5,767 | $291,993 | $87,598 | $204,395 |
| 2019 | $5,516 | $286,270 | $85,881 | $200,389 |
| 2018 | $5,388 | $280,657 | $84,197 | $196,460 |
| 2017 | $5,174 | $275,155 | $82,546 | $192,609 |
| 2016 | $4,966 | $269,761 | $80,928 | $188,833 |
| 2015 | $4,886 | $265,710 | $79,713 | $185,997 |
| 2014 | $4,827 | $260,505 | $78,151 | $182,354 |
Source: Public Records
Map
Nearby Homes
- 2350 Sacramento St
- 2324 Browning St
- 1645 Dwight Way
- 1612 Parker St
- 1142 Dwight Way
- 1515 Derby St
- 1118 Dwight Way
- 1612 Carleton St
- 2231 Byron St
- 2750 Sacramento St
- 2118 California St
- 1450 Ward St
- 2758 Sacramento St
- 2774 Sacramento St
- 2144 Curtis St
- 2782 Sacramento St
- 1092 Dwight Way
- 1039 Channing Way
- 2790 Sacramento St
- 2327 10th St Unit 4
Your Personal Tour Guide
Ask me questions while you tour the home.