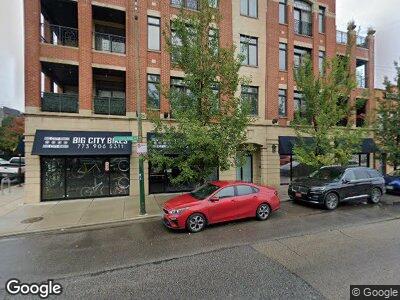
2425 N Ashland Ave Unit C-1 Chicago, IL 60614
West DePaul NeighborhoodEstimated Value: $215,748
--
Bed
--
Bath
--
Sq Ft
6,186
Sq Ft Lot
About This Home
This home is located at 2425 N Ashland Ave Unit C-1, Chicago, IL 60614 and is currently estimated at $215,748. 2425 N Ashland Ave Unit C-1 is a home located in Cook County with nearby schools including Prescott Elementary School, Lincoln Park High School, and St Josaphat School.
Ownership History
Date
Name
Owned For
Owner Type
Purchase Details
Closed on
Jul 1, 2014
Sold by
Stern Gardner H
Bought by
Patel Saurabh
Current Estimated Value
Purchase Details
Closed on
Sep 15, 2006
Sold by
2421 & 25 N Ashland Llc
Bought by
Stern Gardner H
Purchase Details
Closed on
May 15, 2006
Sold by
2421 & 25 N Ashland Llc
Bought by
Gardner Stern Holdings Llc
Home Financials for this Owner
Home Financials are based on the most recent Mortgage that was taken out on this home.
Original Mortgage
$180,000
Interest Rate
8.5%
Mortgage Type
Commercial
Purchase Details
Closed on
Jul 18, 2005
Sold by
1555 Montana Llc
Bought by
2421 & 25 N Ashland Llc
Home Financials for this Owner
Home Financials are based on the most recent Mortgage that was taken out on this home.
Original Mortgage
$165,750
Interest Rate
6.25%
Mortgage Type
Commercial
Create a Home Valuation Report for This Property
The Home Valuation Report is an in-depth analysis detailing your home's value as well as a comparison with similar homes in the area
Home Values in the Area
Average Home Value in this Area
Purchase History
| Date | Buyer | Sale Price | Title Company |
|---|---|---|---|
| Patel Saurabh | $130,000 | Attorneys Title Guaranty Fun | |
| Stern Gardner H | -- | Near North National Title | |
| Gardner Stern Holdings Llc | $235,000 | Near North National Title | |
| 2421 & 25 N Ashland Llc | $190,000 | Ctic |
Source: Public Records
Mortgage History
| Date | Status | Borrower | Loan Amount |
|---|---|---|---|
| Previous Owner | Gardner Stern Holdings Llc | $180,000 | |
| Previous Owner | 2421 & 25 N Ashland Llc | $165,750 | |
| Previous Owner | 1555 Montana Llc | $1,886,977 |
Source: Public Records
Tax History Compared to Growth
Tax History
| Year | Tax Paid | Tax Assessment Tax Assessment Total Assessment is a certain percentage of the fair market value that is determined by local assessors to be the total taxable value of land and additions on the property. | Land | Improvement |
|---|---|---|---|---|
| 2024 | $8,689 | $50,500 | $1,699 | $48,801 |
| 2023 | $8,689 | $42,243 | $3,398 | $38,845 |
| 2022 | $8,689 | $42,243 | $3,398 | $38,845 |
| 2021 | $8,495 | $42,243 | $3,398 | $38,845 |
| 2020 | $10,179 | $45,695 | $3,398 | $42,297 |
| 2019 | $9,181 | $45,695 | $3,398 | $42,297 |
| 2018 | $9,026 | $45,695 | $3,398 | $42,297 |
| 2017 | $6,996 | $32,500 | $3,398 | $29,102 |
| 2016 | $6,509 | $32,500 | $3,398 | $29,102 |
| 2015 | $8,573 | $46,786 | $3,398 | $43,388 |
| 2014 | $7,216 | $38,890 | $3,398 | $35,492 |
| 2013 | $8,071 | $44,375 | $3,398 | $40,977 |
Source: Public Records
Map
Nearby Homes
- 2510 N Marshfield Ave
- 2422 N Clybourn Ave
- 1452 W Fullerton Ave Unit 2
- 2428 N Clybourn Ave
- 2442 N Clybourn Ave Unit 5S
- 2525 N Greenview Ave
- 2343 N Greenview Ave Unit 101
- 2458 N Clybourn Ave
- 2303 N Bosworth Ave Unit 3A
- 2303 N Bosworth Ave Unit PH
- 1516 W Wrightwood Ave Unit 3
- 2424 N Southport Ave Unit A
- 2629 N Ashland Ave Unit 3A
- 2606 N Paulina St
- 2635 N Bosworth Ave Unit 3
- 2635 N Bosworth Ave Unit 2
- 2654 N Greenview Ave Unit 2S
- 2654 N Greenview Ave Unit 1S
- 2654 N Greenview Ave Unit 1N
- 2654 N Greenview Ave Unit 3N
- 2425 N Ashland Ave Unit 3N
- 2425 N Ashland Ave Unit 2N
- 2425 N Ashland Ave Unit 4S
- 2425 N Ashland Ave Unit 3S
- 2425 N Ashland Ave Unit 2S
- 2425 N Ashland Ave Unit C-1
- 1555 W Montana St Unit 2S
- 1555 W Montana St Unit 4S
- 1555 W Montana St Unit 3N
- 1555 W Montana St Unit 3S
- 2425 N Ashland Ave
- 1555 W Montana St Unit 2N
- 2421 N Ashland Ave
- 1545 W Montana St
- 1545 W Montana St Unit 101
- 1545 W Montana St Unit 201
- 1545 W Montana St Unit 301
- 1543 W Montana St Unit 3
- 1543 W Montana St Unit 2
- 1543 W Montana St Unit 1