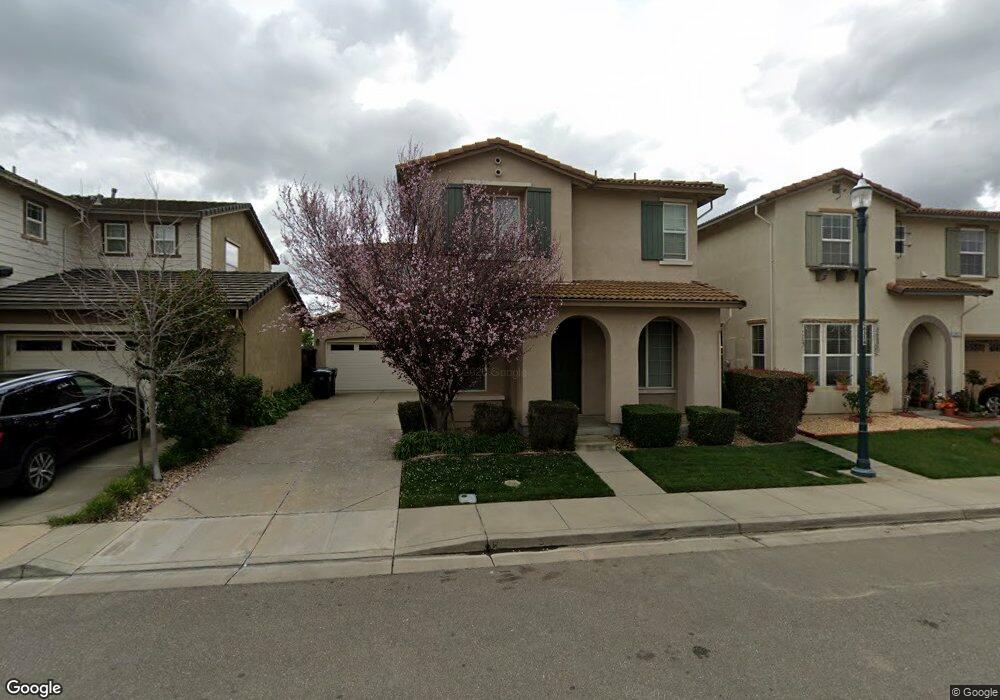
2429 Sheldon Dr Fairfield, CA 94533
Estimated Value: $578,000 - $650,000
3
Beds
3
Baths
1,999
Sq Ft
$299/Sq Ft
Est. Value
About This Home
This home is located at 2429 Sheldon Dr, Fairfield, CA 94533 and is currently estimated at $598,626, approximately $299 per square foot. 2429 Sheldon Dr is a home located in Solano County with nearby schools including Center Elementary School, Golden West Middle School, and Vanden High School.
Ownership History
Date
Name
Owned For
Owner Type
Purchase Details
Closed on
Nov 30, 2018
Sold by
Umphress Jason and Umphress Cecile
Bought by
Napalan Umphress Jason Lee and Napalan Umphress Cecile
Current Estimated Value
Purchase Details
Closed on
Sep 18, 2009
Sold by
Gmac Mortgage Llc
Bought by
Umphress Jason and Umphress Cecile
Home Financials for this Owner
Home Financials are based on the most recent Mortgage that was taken out on this home.
Original Mortgage
$130,000
Outstanding Balance
$84,413
Interest Rate
5.05%
Mortgage Type
New Conventional
Estimated Equity
$514,213
Purchase Details
Closed on
Jul 14, 2009
Sold by
Sanders Ewill Fred
Bought by
Gmac Mortgage Llc and Gmac Mortgage Corporation
Purchase Details
Closed on
Aug 1, 2005
Sold by
Tim Lewis Communities
Bought by
Sanders Ewill Fred
Home Financials for this Owner
Home Financials are based on the most recent Mortgage that was taken out on this home.
Original Mortgage
$372,816
Interest Rate
5.56%
Mortgage Type
Stand Alone First
Create a Home Valuation Report for This Property
The Home Valuation Report is an in-depth analysis detailing your home's value as well as a comparison with similar homes in the area
Home Values in the Area
Average Home Value in this Area
Purchase History
| Date | Buyer | Sale Price | Title Company |
|---|---|---|---|
| Napalan Umphress Jason Lee | -- | None Available | |
| Umphress Jason | $265,000 | First American Title Company | |
| Gmac Mortgage Llc | $242,010 | None Available | |
| Sanders Ewill Fred | $466,500 | First American Title Co |
Source: Public Records
Mortgage History
| Date | Status | Borrower | Loan Amount |
|---|---|---|---|
| Open | Umphress Jason | $130,000 | |
| Previous Owner | Sanders Ewill Fred | $372,816 |
Source: Public Records
Tax History
| Year | Tax Paid | Tax Assessment Tax Assessment Total Assessment is a certain percentage of the fair market value that is determined by local assessors to be the total taxable value of land and additions on the property. | Land | Improvement |
|---|---|---|---|---|
| 2025 | $5,453 | $342,058 | $96,806 | $245,252 |
| 2024 | $5,453 | $335,352 | $94,908 | $240,444 |
| 2023 | $5,404 | $328,778 | $93,048 | $235,730 |
| 2022 | $5,086 | $322,332 | $91,224 | $231,108 |
| 2021 | $5,014 | $316,013 | $89,436 | $226,577 |
| 2020 | $4,946 | $312,773 | $88,519 | $224,254 |
| 2019 | $4,860 | $306,641 | $86,784 | $219,857 |
| 2018 | $4,795 | $300,630 | $85,083 | $215,547 |
| 2017 | $4,664 | $294,736 | $83,415 | $211,321 |
| 2016 | $4,599 | $288,958 | $81,780 | $207,178 |
| 2015 | $4,530 | $284,618 | $80,552 | $204,066 |
| 2014 | $4,451 | $279,044 | $78,975 | $200,069 |
Source: Public Records
Map
Nearby Homes
- 2438 Sheldon Dr
- 2428 Hanson Dr
- 5018 Brown Ln
- 2382 Sheldon Dr
- 2541 Rowe Dr
- 2350 Sheldon Dr
- 5161 Freitas Way
- 5138 Rowe Dr
- 2738 Blakely Ln
- 5311 Gramercy Cir
- 2319 Hancock Dr
- 5291 Finkas Ln
- 2404 Indigo Dr
- 2433 Sanders Ln
- 2746 Gracie Place
- 2426 Lake Club Dr
- 2429 Artisan Way
- 2432 Artisan Way
- 2481 Hancock Dr
- 2464 Lake Club Dr
- 2433 Sheldon Dr
- 2425 Sheldon Dr
- 2437 Sheldon Dr
- 2421 Sheldon Dr
- 2441 Sheldon Dr
- 2434 Sheldon Dr
- 2445 Sheldon Dr
- 2430 Sheldon Dr
- 2417 Sheldon Dr
- 2442 Sheldon Dr
- 2426 Sheldon Dr
- 2449 Sheldon Dr
- 2446 Sheldon Dr
- 2422 Sheldon Dr
- 2413 Sheldon Dr
- 2431 Hanson Dr
- 2435 Hanson Dr
- 2450 Sheldon Dr
- 2427 Hanson Dr
- 2418 Sheldon Dr
Your Personal Tour Guide
Ask me questions while you tour the home.