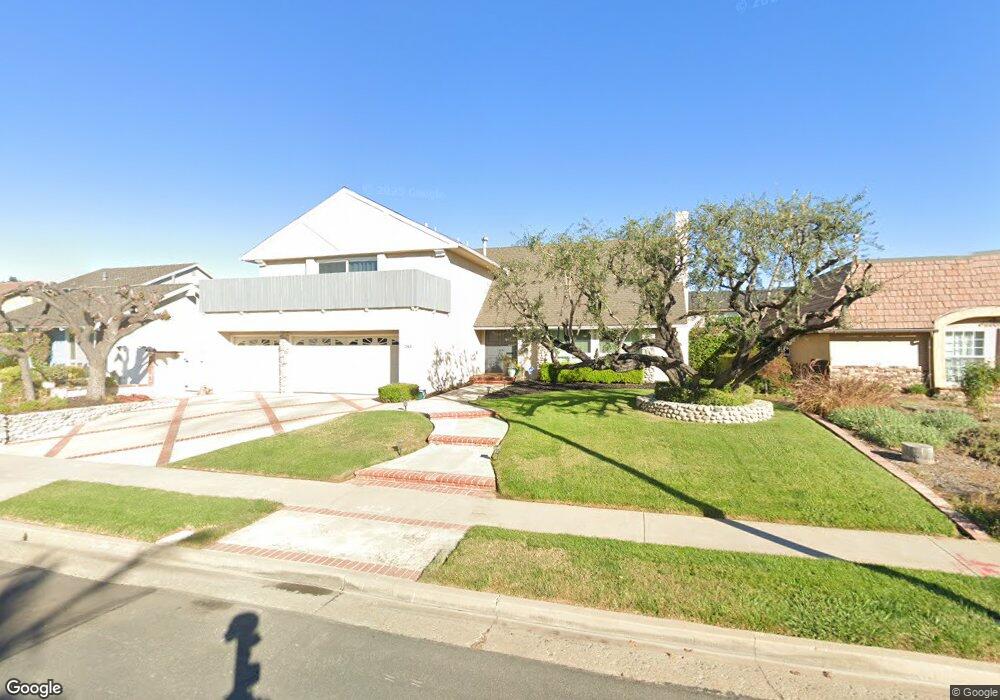
243 Bagnall Ave Placentia, CA 92870
Estimated Value: $1,227,173 - $1,479,000
4
Beds
3
Baths
2,536
Sq Ft
$531/Sq Ft
Est. Value
About This Home
This home is located at 243 Bagnall Ave, Placentia, CA 92870 and is currently estimated at $1,345,543, approximately $530 per square foot. 243 Bagnall Ave is a home located in Orange County with nearby schools including Brookhaven Elementary School, Col. J. K. Tuffree Middle School, and El Dorado High School.
Ownership History
Date
Name
Owned For
Owner Type
Purchase Details
Closed on
Feb 11, 2022
Sold by
Alexander Paul H and Alexander Leslie M
Bought by
Paul And Leslie Alexander 2022 Trust
Current Estimated Value
Purchase Details
Closed on
Sep 10, 2003
Sold by
The David T & Vonda Vandyke Scoates Tr
Bought by
Alexander Paul H and Alexander Leslie M
Home Financials for this Owner
Home Financials are based on the most recent Mortgage that was taken out on this home.
Original Mortgage
$400,000
Interest Rate
4.62%
Mortgage Type
Purchase Money Mortgage
Purchase Details
Closed on
Oct 8, 1999
Sold by
Gullotti Steven E and Gullotti Brianne Brianne
Bought by
Scoates David T and Scoates Vonda Van Dyke
Purchase Details
Closed on
Apr 9, 1999
Sold by
Gullotti Steven E and Gullotti Brianne Brianne
Bought by
Gullotti Steven E and Gullotti Brianne L
Create a Home Valuation Report for This Property
The Home Valuation Report is an in-depth analysis detailing your home's value as well as a comparison with similar homes in the area
Home Values in the Area
Average Home Value in this Area
Purchase History
| Date | Buyer | Sale Price | Title Company |
|---|---|---|---|
| Paul And Leslie Alexander 2022 Trust | -- | Barber Darin W | |
| Alexander Paul H | $535,000 | Orange Coast Title | |
| Scoates David T | $335,000 | Commonwealth Land Title | |
| Gullotti Steven E | -- | -- |
Source: Public Records
Mortgage History
| Date | Status | Borrower | Loan Amount |
|---|---|---|---|
| Previous Owner | Alexander Paul H | $400,000 |
Source: Public Records
Tax History Compared to Growth
Tax History
| Year | Tax Paid | Tax Assessment Tax Assessment Total Assessment is a certain percentage of the fair market value that is determined by local assessors to be the total taxable value of land and additions on the property. | Land | Improvement |
|---|---|---|---|---|
| 2025 | $8,779 | $760,651 | $595,336 | $165,315 |
| 2024 | $8,779 | $745,737 | $583,663 | $162,074 |
| 2023 | $8,605 | $731,115 | $572,218 | $158,897 |
| 2022 | $8,494 | $716,780 | $560,998 | $155,782 |
| 2021 | $8,303 | $702,726 | $549,998 | $152,728 |
| 2020 | $8,329 | $695,521 | $544,359 | $151,162 |
| 2019 | $8,003 | $681,884 | $533,685 | $148,199 |
| 2018 | $7,901 | $668,514 | $523,220 | $145,294 |
| 2017 | $7,769 | $655,406 | $512,960 | $142,446 |
| 2016 | $7,613 | $642,555 | $502,902 | $139,653 |
| 2015 | $7,517 | $632,904 | $495,348 | $137,556 |
| 2014 | $7,301 | $620,507 | $485,645 | $134,862 |
Source: Public Records
Map
Nearby Homes
- 237 Blanquita Way
- 213 E Borromeo Ave
- 213 Appalachian Cir
- 617 Seneca St
- 3002 Blackwood Ct
- 2318 Blackfoot Ave
- 1925 Frederick St
- 719 Cobb Ave
- 3349 Greenleaf Dr
- 2454 Beacon St
- 2938 Arboridge Ct
- 1726 Stanley Ave
- 2917 Cimmaron Ln
- 1640 Valencia Ave
- 1707 Stanley Ave
- 1701 Shaw Cir
- 1525 Havasu Place
- 3378 Merida Ln
- 2885 Winchester St
- 418 Maravilla Ln
- 237 Bagnall Ave
- 249 Bagnall Ave
- 242 Blanquita Way
- 248 Blanquita Way
- 236 Blanquita Way
- 231 Bagnall Ave
- 301 Bagnall Ave
- 242 Bagnall Ave
- 248 Bagnall Ave
- 302 Purdy Ave
- 236 Bagnall Ave
- 230 Blanquita Way
- 300 Bagnall Ave
- 225 Bagnall Ave
- 307 Bagnall Ave
- 230 Bagnall Ave
- 308 Purdy Ave
- 224 Blanquita Way
- 306 Bagnall Ave
- 243 Garfield Ave