
SOLD SEP 13, 2024
RENTED NOV 1, 2024
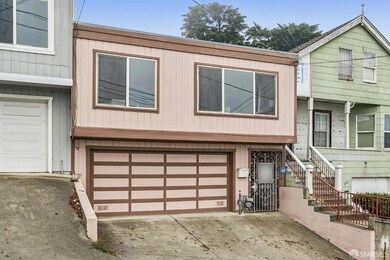
243 Faxon Ave San Francisco, CA 94112
Ingleside Neighborhood
3
Beds
2
Baths
1,270
Sq Ft
2,813
Sq Ft Lot
Highlights
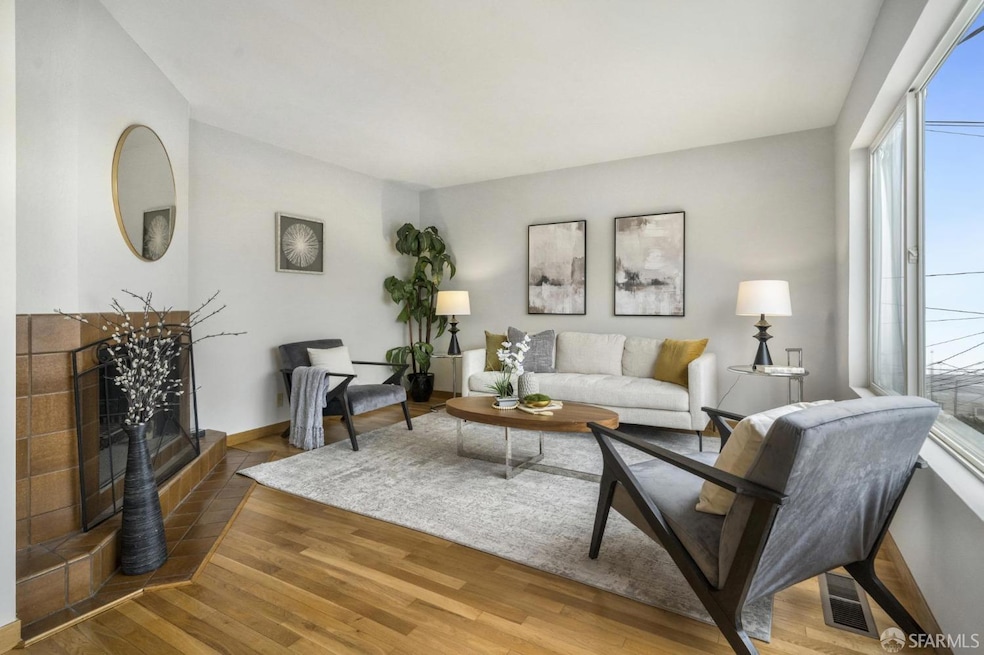
- 1 Fireplace
- 2 Car Attached Garage
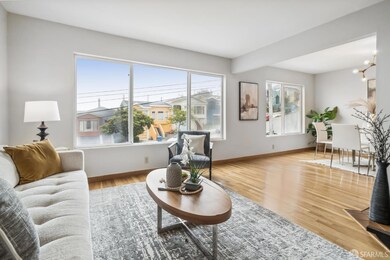
- East Facing Home
- Ortega (Jose) Elementary School Rated A
- Side by Side Parking
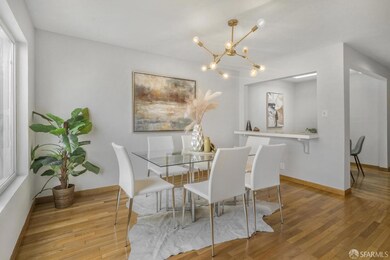
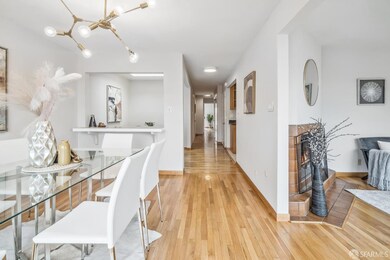
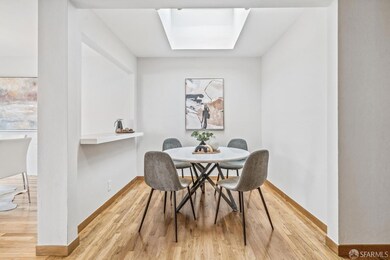
About This Home
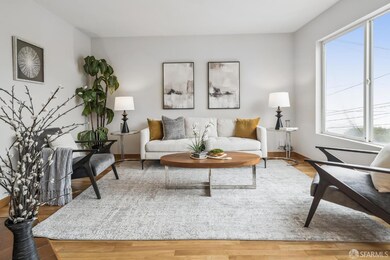
As of September 2024This spacious and well-maintained home in Ingleside offers 3 beds, 2 baths with all living spaces on one level. The East-facing living room with views of SF and skylit formal dining room are spacious and bright. The primary bedroom includes an updated bath and direct access to the yard. The kitchen and second bath are updated as well. The garage downstairs accommodates 2 cars side by side, while the long uncovered driveway accommodates two additional cars side by side. Located just 3 blocks from Ocean Ave and Minnie and Lovie Ward Rec Center, enjoy restaurants, bakeries, and grocery-shopping at Whole Foods and Chinese groceries.
Home Details
Home Type
- Single Family
Est. Annual Taxes
- $8,257
Year Built
- Built in 1980 | Remodeled
Lot Details
- 2,813 Sq Ft Lot
- East Facing Home
Parking
- 2 Car Attached Garage
- 2 Open Parking Spaces
- Front Facing Garage
- Side by Side Parking
Interior Spaces
- 2 Full Bathrooms
- 1,270 Sq Ft Home
- 2-Story Property
- 1 Fireplace
- Laundry in Garage
Listing and Financial Details
- Assessor Parcel Number 7013-011
Ownership History
Date
Name
Owned For
Owner Type
Purchase Details
Listed on
Sep 4, 2024
Closed on
Sep 10, 2024
Sold by
Dzeksterman 2012 Revocble Trust and Dzeksterman Lev
Bought by
Pan Xing and Zhang Ying Pan
Seller's Agent
Kevin Wong
Compass
Buyer's Agent
Kevin Wong
Compass
Sold Price
$4,800
Views
121
Current Estimated Value
Home Financials for this Owner
Home Financials are based on the most recent Mortgage that was taken out on this home.
Estimated Appreciation
$1,134,978
Avg. Annual Appreciation
1.57%
Original Mortgage
$766,550
Outstanding Balance
$759,755
Interest Rate
6.73%
Mortgage Type
New Conventional
Estimated Equity
$380,023
Purchase Details
Closed on
Oct 27, 2020
Sold by
Dzeksterman Lev and Dzeksterman Alla
Bought by
Dzeksterman Lev and Dzeksterman Alla
Home Financials for this Owner
Home Financials are based on the most recent Mortgage that was taken out on this home.
Original Mortgage
$215,000
Interest Rate
2.8%
Mortgage Type
New Conventional
Purchase Details
Closed on
Mar 24, 2015
Sold by
Dzektserman Lev and Dzektserman Alla
Bought by
Dzektserman 2012 Revocable Trust and Dzektserman Alla
Home Financials for this Owner
Home Financials are based on the most recent Mortgage that was taken out on this home.
Original Mortgage
$338,000
Interest Rate
3.65%
Mortgage Type
New Conventional
Purchase Details
Closed on
Oct 20, 2012
Sold by
Dzektserman Lev and Dzektserman Alla
Bought by
The Dzektserman 2012 Revocable Trust and Dzektserman Lev
Purchase Details
Closed on
Sep 21, 2010
Sold by
Dzektserman Lev and Dzektserman Alla
Bought by
Dzektserman Lev and Dzektserman Alla
Home Financials for this Owner
Home Financials are based on the most recent Mortgage that was taken out on this home.
Original Mortgage
$370,000
Interest Rate
4.38%
Mortgage Type
New Conventional
Purchase Details
Closed on
Sep 26, 2001
Sold by
Rajpara Ashwin and Rajpara Bina A
Bought by
Dzektserman Lev and Dzektserman Alla
Home Financials for this Owner
Home Financials are based on the most recent Mortgage that was taken out on this home.
Original Mortgage
$400,000
Interest Rate
7.12%
Similar Homes in San Francisco, CA
-
$1,475,000
- 6 Beds
- 2 Baths
- 2,290 Sq Ft
- 447 Justin Dr
- San Francisco, CA
This home offers a rare opportunity to own a beautifully renovated property with flexible living options. Thoughtfully updated with high-end finishes, both levels feature modern kitchens, sleek bathrooms, and open-concept living spaces filled with natural light. The lower level enjoys direct access to a private backyardideal for outdoor entertaining or quiet relaxationwhile the upper level boasts
Ben Marmol Intero Real Estate Services
Create a Home Valuation Report for This Property
The Home Valuation Report is an in-depth analysis detailing your home's value as well as a comparison with similar homes in the area
Home Values in the Area
Average Home Value in this Area
Purchase History
| Date | Type | Sale Price | Title Company |
|---|---|---|---|
| Grant Deed | -- | Old Republic Title | |
| Interfamily Deed Transfer | -- | Old Republic Title | |
| Interfamily Deed Transfer | -- | Old Republic Title Company | |
| Interfamily Deed Transfer | -- | First American Title Company | |
| Interfamily Deed Transfer | -- | None Available | |
| Interfamily Deed Transfer | -- | North American Title Company | |
| Grant Deed | $445,000 | Financial Title Company |
Source: Public Records
Mortgage History
| Date | Status | Loan Amount | Loan Type |
|---|---|---|---|
| Open | $766,550 | New Conventional | |
| Previous Owner | $215,000 | New Conventional | |
| Previous Owner | $338,000 | New Conventional | |
| Previous Owner | $362,000 | New Conventional | |
| Previous Owner | $364,000 | New Conventional | |
| Previous Owner | $370,000 | New Conventional | |
| Previous Owner | $244,000 | Credit Line Revolving | |
| Previous Owner | $218,600 | Credit Line Revolving | |
| Previous Owner | $200,000 | Credit Line Revolving | |
| Previous Owner | $390,000 | Unknown | |
| Previous Owner | $394,000 | Unknown | |
| Previous Owner | $398,000 | Unknown | |
| Previous Owner | $400,000 | Unknown | |
| Previous Owner | $400,000 | No Value Available |
Source: Public Records
Property History
| Date | Event | Price | Change | Sq Ft Price |
|---|---|---|---|---|
| 11/01/2024 11/01/24 | Rented | $4,800 | -99.6% | -- |
| 10/27/2024 10/27/24 | Under Contract | -- | -- | -- |
| 09/13/2024 09/13/24 | Sold | $1,125,000 | 0.0% | $886 / Sq Ft |
| 09/04/2024 09/04/24 | For Rent | $4,800 | 0.0% | -- |
| 08/29/2024 08/29/24 | Pending | -- | -- | -- |
| 08/02/2024 08/02/24 | For Sale | $1,150,000 | -- | $906 / Sq Ft |
Source: San Francisco Association of REALTORS® MLS
Tax History Compared to Growth
Tax History
| Year | Tax Paid | Tax Assessment Tax Assessment Total Assessment is a certain percentage of the fair market value that is determined by local assessors to be the total taxable value of land and additions on the property. | Land | Improvement |
|---|---|---|---|---|
| 2025 | $8,257 | $1,125,000 | $787,500 | $337,500 |
| 2024 | $8,257 | $644,484 | $386,695 | $257,789 |
| 2023 | $8,125 | $631,848 | $379,113 | $252,735 |
| 2022 | $7,958 | $619,460 | $371,680 | $247,780 |
| 2021 | $7,812 | $607,315 | $364,393 | $242,922 |
| 2020 | $7,860 | $601,089 | $360,657 | $240,432 |
| 2019 | $7,592 | $589,304 | $353,586 | $235,718 |
| 2018 | $7,336 | $577,750 | $346,653 | $231,097 |
| 2017 | $6,950 | $566,422 | $339,856 | $226,566 |
| 2016 | $6,818 | $555,317 | $333,193 | $222,124 |
| 2015 | $6,731 | $546,977 | $328,189 | $218,788 |
| 2014 | $6,294 | $536,264 | $321,761 | $214,503 |
Source: Public Records
Agents Affiliated with this Home
-
Kevin Wong
Seller's Agent in 2024
Kevin Wong
Compass
(415) 290-2927
1 in this area
71 Total Sales
-
Alexandra Moari
A
Seller Co-Listing Agent in 2024
Alexandra Moari
California State Realty, Inc.
(415) 608-0734
1 in this area
7 Total Sales
Map
Source: San Francisco Association of REALTORS® MLS
MLS Number: 424034282
APN: 7013-011
Disclaimer: Certain information contained herein is derived from information provided by parties other than Homes.com. All information provided is deemed reliable, but is not guaranteed to be accurate and should be independently verified.
![]() IDX information is provided exclusively for personal, non-commercial use, and may not be used for any purpose other than to identify prospective properties consumers may be interested in purchasing.
IDX information is provided exclusively for personal, non-commercial use, and may not be used for any purpose other than to identify prospective properties consumers may be interested in purchasing.
Information is deemed reliable but not guaranteed.
Nearby Homes
- 946 Capitol Ave
- 271 Montana St
- 20 Sargent St
- 224 Shields St
- 980 Holloway Ave
- 324 Holloway Ave
- 419 Garfield St
- 137 Holloway Ave
- 163 Lee Ave
- 133 Holloway Ave
- 63 Minerva St
- 5000 Summit St
- 69 Lobos St
- 106 Broad St
- 230 Ralston St
- 1920 Ocean Ave Unit 1E
- 26 Southwood Dr
- 495 Ralston St
- 41 Westwood Dr
- 108 Sadowa St