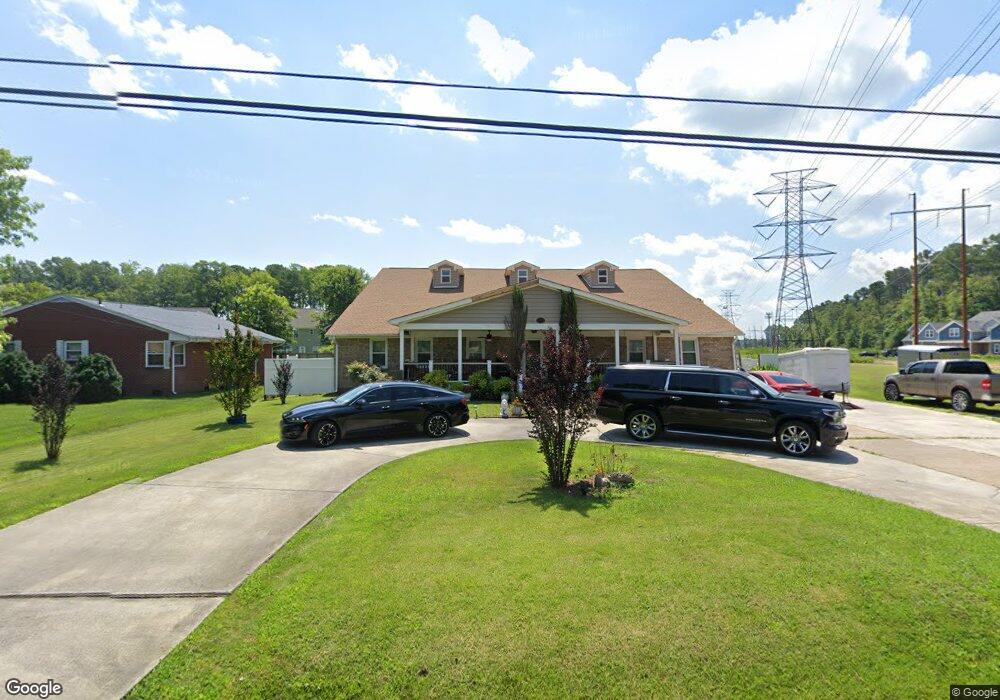
2433 Bugle Dr W Chesapeake, VA 23321
Western Branch NeighborhoodEstimated Value: $688,683 - $921,000
5
Beds
4
Baths
6,890
Sq Ft
$112/Sq Ft
Est. Value
About This Home
This home is located at 2433 Bugle Dr W, Chesapeake, VA 23321 and is currently estimated at $771,921, approximately $112 per square foot. 2433 Bugle Dr W is a home located in Chesapeake City with nearby schools including Western Branch Primary School, Western Branch Intermediate School, and Western Branch Middle School.
Ownership History
Date
Name
Owned For
Owner Type
Purchase Details
Closed on
Jun 25, 2015
Sold by
Sickelton Trustee Burnis M
Bought by
Ashby Stewart
Current Estimated Value
Home Financials for this Owner
Home Financials are based on the most recent Mortgage that was taken out on this home.
Original Mortgage
$474,486
Outstanding Balance
$371,137
Interest Rate
4.03%
Mortgage Type
VA
Estimated Equity
$400,784
Purchase Details
Closed on
Jun 23, 2015
Sold by
Sepe Dino and Sepe Marie L
Bought by
Ashby Stewart and Ashby Belinda S
Home Financials for this Owner
Home Financials are based on the most recent Mortgage that was taken out on this home.
Original Mortgage
$474,486
Outstanding Balance
$371,137
Interest Rate
4.03%
Mortgage Type
VA
Estimated Equity
$400,784
Purchase Details
Closed on
Aug 27, 2012
Sold by
Ifah 24Ee Bugle Drive W Llc
Bought by
Jmj319mrm Llc
Create a Home Valuation Report for This Property
The Home Valuation Report is an in-depth analysis detailing your home's value as well as a comparison with similar homes in the area
Home Values in the Area
Average Home Value in this Area
Purchase History
| Date | Buyer | Sale Price | Title Company |
|---|---|---|---|
| Ashby Stewart | $466,500 | -- | |
| Ashby Stewart | -- | -- | |
| Jmj319mrm Llc | -- | -- |
Source: Public Records
Mortgage History
| Date | Status | Borrower | Loan Amount |
|---|---|---|---|
| Open | Ashby Stewart | $474,486 |
Source: Public Records
Tax History
| Year | Tax Paid | Tax Assessment Tax Assessment Total Assessment is a certain percentage of the fair market value that is determined by local assessors to be the total taxable value of land and additions on the property. | Land | Improvement |
|---|---|---|---|---|
| 2025 | $6,436 | $663,700 | $145,000 | $518,700 |
| 2024 | $5,968 | $637,200 | $145,000 | $492,200 |
| 2023 | $5,962 | $590,900 | $130,000 | $460,900 |
| 2022 | $6,193 | $613,200 | $120,000 | $493,200 |
| 2021 | $5,493 | $523,100 | $90,000 | $433,100 |
| 2020 | $5,296 | $504,400 | $90,000 | $414,400 |
| 2019 | $5,214 | $496,600 | $85,000 | $411,600 |
| 2018 | $4,980 | $488,100 | $80,000 | $408,100 |
| 2017 | $5,125 | $488,100 | $80,000 | $408,100 |
| 2016 | $4,921 | $468,700 | $80,000 | $388,700 |
| 2015 | $3,965 | $377,600 | $75,000 | $302,600 |
| 2014 | $3,891 | $370,600 | $75,000 | $295,600 |
Source: Public Records
Map
Nearby Homes
- 2314 Alcott Way
- 2330 Alcott Way
- 2521 Drum Creek Rd
- 2309 Drum Creek Rd
- 2617 N Elizabeth Harbor Dr
- 2455 Leytonstone Dr Unit 63
- 4415 McCaan Quay
- 4332 Farringdon Way
- 2506 Leytonstone Dr
- 2967 Drum Point Crescent
- 2704 Big Bend Ct
- 4332 Hillingdon Bend Unit 104
- 4316 Hillingdon Bend Unit 304
- 4500 McRae Close
- 2644 Leytonstone Dr
- 4513 Overlook Place
- 4501 Overlook Place
- 3328 Cricket Hollow Ln
- 2133 Portsmouth Blvd
- 3401 Cricket Hollow Ln
- 2431 Bugle Dr W
- 2435 Bugle Dr W
- 2430 Bugle Dr W
- 2429 Bugle Dr W
- 2429 W Bugle Dr
- 2432 Bugle Dr W
- 2436 Mandolin Ct
- 2434 Bugle Dr W
- 2428 Bugle Dr W
- 2432 Mandolin Ct
- 2437 Bugle Dr W
- 2440 Mandolin Ct
- 2436 Bugle Dr W
- 2427 Bugle Dr W
- 2426 Bugle Dr W Unit A
- 2426 Bugle Dr W
- 2426 Bugle Dr W
- 2428 Mandolin Ct
- 2439 Bugle Dr W
- 2426a Bugle Dr W
Your Personal Tour Guide
Ask me questions while you tour the home.