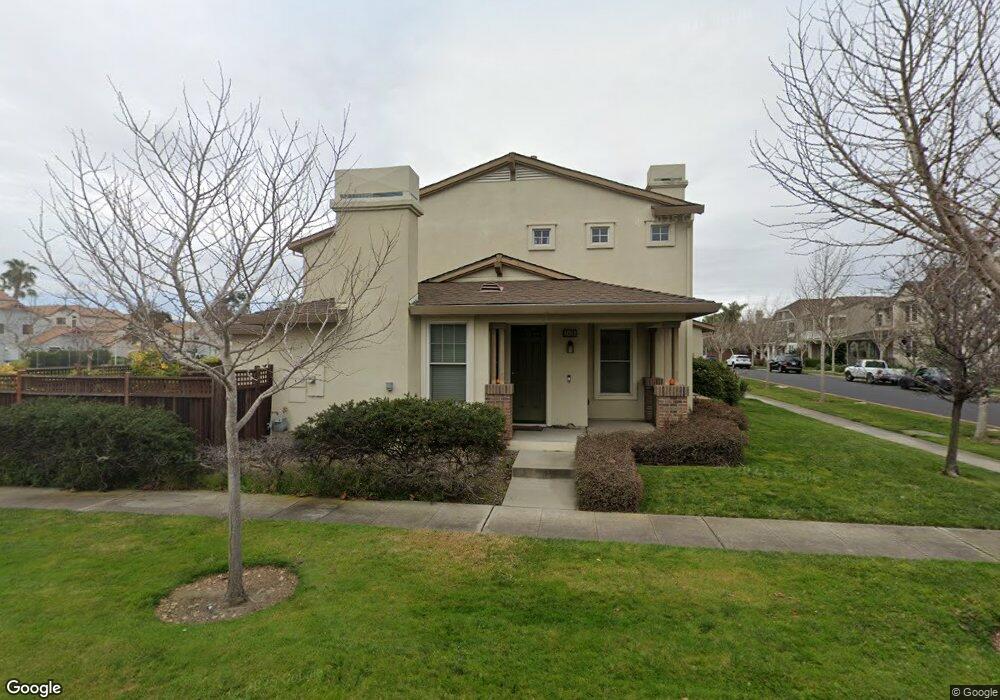
2438 Sandpiper Ct Alameda, CA 94501
West Alameda NeighborhoodEstimated Value: $1,107,000 - $1,388,000
3
Beds
3
Baths
1,702
Sq Ft
$722/Sq Ft
Est. Value
About This Home
This home is located at 2438 Sandpiper Ct, Alameda, CA 94501 and is currently estimated at $1,229,207, approximately $722 per square foot. 2438 Sandpiper Ct is a home located in Alameda County with nearby schools including Ruby Bridges Elementary School, Encinal Junior/Senior High, and The Academy of Alameda TK-8 School.
Ownership History
Date
Name
Owned For
Owner Type
Purchase Details
Closed on
Apr 27, 2021
Sold by
Lung Chi Leung and Lung Sanny Lai
Bought by
Lung Chi Leung and Lung Sanny Lai
Current Estimated Value
Home Financials for this Owner
Home Financials are based on the most recent Mortgage that was taken out on this home.
Original Mortgage
$119,000
Outstanding Balance
$90,093
Interest Rate
3.1%
Mortgage Type
New Conventional
Estimated Equity
$1,139,114
Purchase Details
Closed on
Mar 30, 2007
Sold by
Bayport Alameda Associates Llc
Bought by
Leung Lung Sanny Lai Hing and Leung Lung Chi
Home Financials for this Owner
Home Financials are based on the most recent Mortgage that was taken out on this home.
Original Mortgage
$201,400
Interest Rate
6.11%
Mortgage Type
New Conventional
Create a Home Valuation Report for This Property
The Home Valuation Report is an in-depth analysis detailing your home's value as well as a comparison with similar homes in the area
Home Values in the Area
Average Home Value in this Area
Purchase History
| Date | Buyer | Sale Price | Title Company |
|---|---|---|---|
| Lung Chi Leung | -- | Chicago Title Company | |
| Leung Lung Sanny Lai Hing | $212,000 | First American Title Co |
Source: Public Records
Mortgage History
| Date | Status | Borrower | Loan Amount |
|---|---|---|---|
| Open | Lung Chi Leung | $119,000 | |
| Closed | Leung Lung Sanny Lai Hing | $201,400 |
Source: Public Records
Tax History
| Year | Tax Paid | Tax Assessment Tax Assessment Total Assessment is a certain percentage of the fair market value that is determined by local assessors to be the total taxable value of land and additions on the property. | Land | Improvement |
|---|---|---|---|---|
| 2025 | $5,303 | $277,011 | $85,203 | $198,808 |
| 2024 | $5,303 | $271,444 | $83,533 | $194,911 |
| 2023 | $5,130 | $272,985 | $81,895 | $191,090 |
| 2022 | $5,509 | $260,634 | $80,290 | $187,344 |
| 2021 | $5,402 | $255,387 | $78,716 | $183,671 |
| 2020 | $6,142 | $259,697 | $77,909 | $181,788 |
| 2019 | $5,598 | $254,607 | $76,382 | $178,225 |
| 2018 | $5,467 | $249,617 | $74,885 | $174,732 |
| 2017 | $5,269 | $244,724 | $73,417 | $171,307 |
| 2016 | $5,225 | $239,926 | $71,978 | $167,948 |
| 2015 | $5,177 | $236,324 | $70,897 | $165,427 |
| 2014 | $4,995 | $231,696 | $69,509 | $162,187 |
Source: Public Records
Map
Nearby Homes
- 142 Coronado Ave
- 416 Bohol Circle Ln
- 1815 2nd St
- 1808 Main St
- 313 Spruce St
- 1820 3rd St
- 109 Cypress St Unit C
- 108 Cypress St Unit D
- 310 Spruce St
- 1710 2nd St
- 221 Pacific Ave
- 318 Cypress St Unit D
- 2870 Derbyline Ln
- 405 Sentinel Dr
- 538 Martin Mariner Ave
- 646 Eucalyptus Way
- 1705 5th St
- 477 Mitchell Ave
- 1 Avocet Ct
- 2836 Tradewind Dr
Your Personal Tour Guide
Ask me questions while you tour the home.