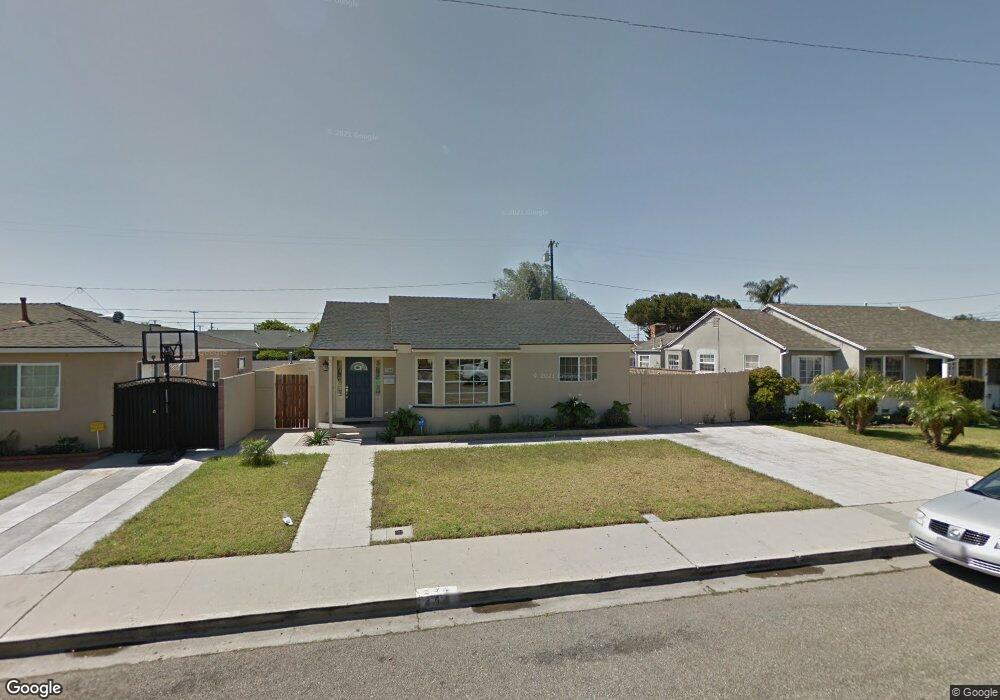
244 E Fir Ave Unit 1 Oxnard, CA 93033
Cal-Gisler NeighborhoodEstimated Value: $582,000 - $718,000
3
Beds
2
Baths
1,200
Sq Ft
$549/Sq Ft
Est. Value
About This Home
This home is located at 244 E Fir Ave Unit 1, Oxnard, CA 93033 and is currently estimated at $658,570, approximately $548 per square foot. 244 E Fir Ave Unit 1 is a home located in Ventura County with nearby schools including Elm Street Elementary School, R.J. Frank Academy of Marine Science & Engineering, and Santa Clara High School.
Ownership History
Date
Name
Owned For
Owner Type
Purchase Details
Closed on
Jul 30, 2012
Sold by
Barrios Areli
Bought by
Medina Fernando
Current Estimated Value
Home Financials for this Owner
Home Financials are based on the most recent Mortgage that was taken out on this home.
Original Mortgage
$265,109
Interest Rate
3.5%
Mortgage Type
FHA
Purchase Details
Closed on
Jun 14, 2012
Sold by
Chin Hyun Choo and Chin Kyung Soon
Bought by
Medina Fernando
Home Financials for this Owner
Home Financials are based on the most recent Mortgage that was taken out on this home.
Original Mortgage
$265,109
Interest Rate
3.5%
Mortgage Type
FHA
Purchase Details
Closed on
Feb 27, 2012
Sold by
U S Bank National Association
Bought by
Chin Hyun Choo and Chin Kyung Soon
Purchase Details
Closed on
Jul 26, 2011
Sold by
Garibay Juan J
Bought by
U S Bank National Association
Purchase Details
Closed on
Jun 7, 2006
Sold by
Soto Jose
Bought by
Garibay Juan J
Home Financials for this Owner
Home Financials are based on the most recent Mortgage that was taken out on this home.
Original Mortgage
$27,000
Interest Rate
6.19%
Mortgage Type
Stand Alone Second
Purchase Details
Closed on
Jul 29, 2005
Sold by
Villanueva Alfred and Villanueva Guadalupe A
Bought by
Soto Jose A
Home Financials for this Owner
Home Financials are based on the most recent Mortgage that was taken out on this home.
Original Mortgage
$376,000
Interest Rate
7%
Mortgage Type
Fannie Mae Freddie Mac
Purchase Details
Closed on
Sep 14, 1995
Sold by
Villanueva Alfred D
Bought by
Villanueva Alfred D and Villanueva Guadalupe A
Home Financials for this Owner
Home Financials are based on the most recent Mortgage that was taken out on this home.
Original Mortgage
$65,000
Interest Rate
7.88%
Create a Home Valuation Report for This Property
The Home Valuation Report is an in-depth analysis detailing your home's value as well as a comparison with similar homes in the area
Home Values in the Area
Average Home Value in this Area
Purchase History
| Date | Buyer | Sale Price | Title Company |
|---|---|---|---|
| Medina Fernando | -- | Fidelity National Title Co | |
| Medina Fernando | $270,000 | Fidelity National Title Co | |
| Chin Hyun Choo | $195,500 | Landsafe Title | |
| U S Bank National Association | $187,155 | None Available | |
| Garibay Juan J | $540,000 | United Title Company | |
| Soto Jose A | $470,000 | Multiple | |
| Villanueva Alfred D | -- | Chicago Title Co | |
| Villanueva Alfred D | -- | Chicago Title Co |
Source: Public Records
Mortgage History
| Date | Status | Borrower | Loan Amount |
|---|---|---|---|
| Previous Owner | Medina Fernando | $265,109 | |
| Previous Owner | Garibay Juan J | $27,000 | |
| Previous Owner | Garibay Juan J | $432,000 | |
| Previous Owner | Soto Jose A | $94,000 | |
| Previous Owner | Soto Jose A | $376,000 | |
| Previous Owner | Villanueva Alfred D | $65,000 |
Source: Public Records
Tax History
| Year | Tax Paid | Tax Assessment Tax Assessment Total Assessment is a certain percentage of the fair market value that is determined by local assessors to be the total taxable value of land and additions on the property. | Land | Improvement |
|---|---|---|---|---|
| 2025 | $3,971 | $332,470 | $184,707 | $147,763 |
| 2024 | $3,971 | $325,951 | $181,085 | $144,866 |
| 2023 | $3,825 | $319,560 | $177,534 | $142,026 |
| 2022 | $3,709 | $313,295 | $174,053 | $139,242 |
| 2021 | $3,678 | $307,152 | $170,640 | $136,512 |
| 2020 | $3,745 | $304,005 | $168,892 | $135,113 |
| 2019 | $3,638 | $298,045 | $165,581 | $132,464 |
| 2018 | $3,586 | $292,202 | $162,335 | $129,867 |
| 2017 | $3,402 | $286,473 | $159,152 | $127,321 |
| 2016 | $3,282 | $280,857 | $156,032 | $124,825 |
| 2015 | $3,316 | $276,641 | $153,690 | $122,951 |
| 2014 | $3,295 | $271,225 | $150,681 | $120,544 |
Source: Public Records
Map
Nearby Homes
- 225 W Iris St
- 1239 S C St
- 2024 S J St
- 1127 S C St
- 3151 Fournier St
- 3130 Paula St
- 865 S B St Unit Q1
- 819 S B St Unit 34
- 1030 Ilena St
- 633 Meta St
- 2151 E Wooley Rd
- 3631 La Costa Place
- 3638 S B St
- 1431 Casa San Carlos Ln Unit B
- 360 Ibsen Place Unit 129
- 860 Morro Way
- 1140 Teakwood St
- 603 S G St
- 140 Gaviota Place Unit 157
- 550 S G St
Your Personal Tour Guide
Ask me questions while you tour the home.